- Page 3 and 4:
SWIM22 - 22 nd Salt Water Intrusion
- Page 5 and 6:
Local Supporting Organizing TeamMar
- Page 7 and 8:
Peter StuyfzandKiwa Water Research,
- Page 9 and 10:
PrefaceWelcome to the 22 nd Salt Wa
- Page 11 and 12:
SUMMARYKeynote Lectures pg 13Coasta
- Page 13:
Groundwater hypersalinization in a
- Page 16 and 17:
Hydrostratigraphic Study of Itaipua
- Page 18 and 19:
Keynote Lectures
- Page 20 and 21:
22 nd Salt Water Intrusion Meeting:
- Page 22 and 23:
22 nd Salt Water Intrusion Meeting:
- Page 24 and 25:
22 nd Salt Water Intrusion Meeting:
- Page 26 and 27:
22 nd Salt Water Intrusion Meeting:
- Page 28 and 29:
22 nd Salt Water Intrusion Meeting:
- Page 30 and 31:
22 nd Salt Water Intrusion Meeting:
- Page 32 and 33:
22 nd Salt Water Intrusion Meeting:
- Page 35:
Effects of sea levelrise and climat
- Page 38 and 39:
22 nd Salt Water Intrusion Meeting:
- Page 40 and 41:
Hans Sulzbacher 1 ; Helga Wiederhol
- Page 43:
Resistivity [Ωm]0.1 1 10 100 10000
- Page 46 and 47:
22 nd Salt Water Intrusion Meeting:
- Page 48 and 49:
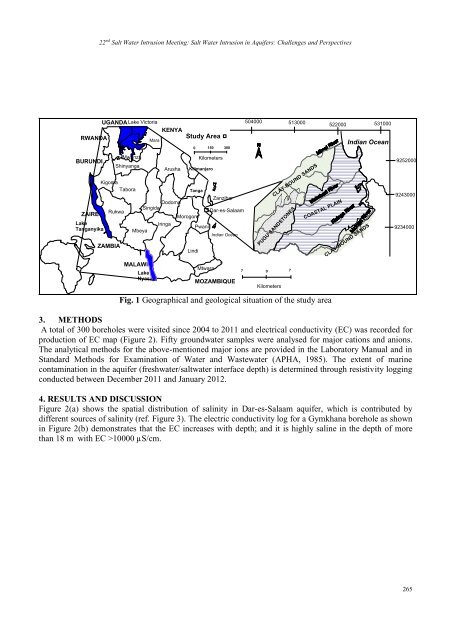
2. METHODS Figure 1a.
- Page 50 and 51:
4. DISCUSSION AND CONCLUSIONSREFERE
- Page 52 and 53:
22 nd Salt Water Intrusion Meeting:
- Page 55 and 56:
22 nd Salt Water Intrusion Meeting:
- Page 57 and 58:
METHODS 51
- Page 59 and 60:
DISCUSSION AND CONCLUSIONS
- Page 61 and 62:
22 nd Salt Water Intrusion Meeting:
- Page 63 and 64:
22 nd Salt Water Intrusion Meeting:
- Page 65 and 66:
22 nd Salt Water Intrusion Meeting:
- Page 67 and 68:
2. RESULTS, HOW TO GET THERE AND WH
- Page 70 and 71:
STUDY OF THE SALTWATER-FRESHWATER I
- Page 73 and 74:
4. DISCUSSION5. CONCLUSIONS67
- Page 75:
Hydrogeochemical and isotopicmethod
- Page 78 and 79:
22 nd Salt Water Intrusion Meeting:
- Page 80 and 81:
Figure 1 Location map of study area
- Page 82 and 83:
Therefore, it was clarified that th
- Page 84 and 85:
22 nd Salt Water Intrusion Meeting:
- Page 86 and 87:
22 nd Salt Water Intrusion Meeting:
- Page 88 and 89:
GROUNDWATER HYPERSALINIZATION IN A
- Page 90:
3. RESULTS AND DISCUSSIONS
- Page 93 and 94:
22 nd Salt Water Intrusion Meeting:
- Page 95 and 96:
2 nd Salt Water Intrusion Meeting:
- Page 97 and 98:
2 nd Salt Water Intrusion Meeting:
- Page 103 and 104:
22 nd Salt Water Intrusion Meeting:
- Page 105 and 106:
22 nd Salt Water Intrusion Meeting:
- Page 107 and 108:
22 nd Salt Water Intrusion Meeting:
- Page 109 and 110:
22 nd Salt Water Intrusion Meeting:
- Page 111:
22 nd Salt Water Intrusion Meeting:
- Page 115 and 116:
22 nd Salt Water Intrusion Meeting:
- Page 117 and 118:
22 nd Salt Water Intrusion Meeting:
- Page 119 and 120:
22 nd Salt Water Intrusion Meeting:
- Page 121 and 122:
22 nd Salt Water Intrusion Meeting:
- Page 123 and 124:
22 nd Salt Water Intrusion Meeting:
- Page 125 and 126:
22 nd Salt Water Intrusion Meeting:
- Page 127 and 128:
22 nd Salt Water Intrusion Meeting:
- Page 129 and 130:
22 nd Salt Water Intrusion Meeting:
- Page 131 and 132:
22 nd Salt Water Intrusion Meeting:
- Page 133 and 134:
22 nd Salt Water Intrusion Meeting:
- Page 135 and 136:
22 nd Salt Water Intrusion Meeting:
- Page 137 and 138:
22 nd Salt Water Intrusion Meeting:
- Page 139 and 140:
GROUNDWATER ARTIFICIAL RECHARGE IN
- Page 141 and 142:
2. GEOLOGICAL SETTING 3. H
- Page 143 and 144:
22 nd Salt Water Intrusion Meeting:
- Page 145 and 146:
22 nd Salt Water Intrusion Meeting:
- Page 147 and 148:
22 nd Salt Water Intrusion Meeting:
- Page 149 and 150:
22 nd Salt Water Intrusion Meeting:
- Page 151 and 152:
145
- Page 153 and 154:
147
- Page 155 and 156:
1. INTRODUCTION 2. MATERIALS AND ME
- Page 157 and 158:
4. CONCLUSIONS
- Page 159 and 160:
22 nd Salt Water Intrusion Meeting:
- Page 161 and 162:
22 nd Salt Water Intrusion Meeting:
- Page 163 and 164:
22 nd Salt Water Intrusion Meeting:
- Page 165 and 166:
22 nd Salt Water Intrusion Meeting:
- Page 167 and 168:
22 nd Salt Water Intrusion Meeting:
- Page 169 and 170:
22 nd Salt Water Intrusion Meeting:
- Page 171 and 172:
22 nd Salt Water Intrusion Meeting:
- Page 173:
New approaches onmodelling (general
- Page 176 and 177:
22 nd Salt Water Intrusion Meeting:
- Page 178 and 179:
22 nd Salt Water Intrusion Meeting:
- Page 180 and 181:
22 nd Salt Water Intrusion Meeting:
- Page 182 and 183:
22 nd Salt Water Intrusion Meeting:
- Page 184 and 185:
22 nd Salt Water Intrusion Meeting:
- Page 186 and 187:
22 nd Salt Water Intrusion Meeting:
- Page 188 and 189:
22 nd Salt Water Intrusion Meeting:
- Page 190 and 191:
22 nd Salt Water Intrusion Meeting:
- Page 192 and 193:
22 nd Salt Water Intrusion Meeting:
- Page 194 and 195:
Ruben Caljé 1 ; Frans Schaars 1 ;
- Page 196 and 197:
Figure 2: The modeled interface dep
- Page 199:
Selected case studies
- Page 202 and 203:
CONCEPTUAL MODEL OF DAR ES SALAAM Q
- Page 204 and 205:
198
- Page 206 and 207:
22 nd Salt Water Intrusion Meeting:
- Page 208 and 209:
22 nd Salt Water Intrusion Meeting:
- Page 210 and 211:
1. INTRODUCTION 2. HYDROGEOCHEMI
- Page 212 and 213:
1,61,41,210,80,60,40,20H-3 (TU)Luiz
- Page 214 and 215:
22 nd Salt Water Intrusion Meeting:
- Page 216 and 217:
Saltwater intrusionsAquifer partly
- Page 218 and 219:
U4Quakenbrück212
- Page 220 and 221: 22 nd Salt Water Intrusion Meeting:
- Page 223: Understanding of salinewater hydrod
- Page 226 and 227: 22 nd Salt Water Intrusion Meeting:
- Page 228 and 229: 22 nd Salt Water Intrusion Meeting:
- Page 230 and 231: 22 nd Salt Water Intrusion Meeting:
- Page 232 and 233: 22 nd Salt Water Intrusion Meeting:
- Page 234 and 235: 22 nd Salt Water Intrusion Meeting:
- Page 236 and 237: Marie Perriquet 1,2 ;Tiernan Henry
- Page 238 and 239: 232
- Page 240 and 241: ACKNOWLEDGEMENTREFERENCES234
- Page 242 and 243: 22 nd Salt Water Intrusion Meeting:
- Page 244 and 245: 22 nd Salt Water Intrusion Meeting:
- Page 246 and 247: 22 nd Salt Water Intrusion Meeting:
- Page 248 and 249: 22 nd Salt Water Intrusion Meeting:
- Page 250 and 251: 22 nd Salt Water Intrusion Meeting:
- Page 252 and 253: 22 nd Salt Water Intrusion Meeting:
- Page 254 and 255: 22 nd Salt Water Intrusion Meeting:
- Page 256 and 257: 22 nd Salt Water Intrusion Meeting:
- Page 258 and 259: 22 nd Salt Water Intrusion Meeting:
- Page 260 and 261: 1. INTRODUCTION2. EXAMPLE: UPCONING
- Page 262 and 263: REFERENCES256
- Page 264 and 265: 258
- Page 266 and 267: Figure 1. Computed density and mole
- Page 268 and 269: 262
- Page 272 and 273: Depth (m)22 nd Salt Water Intrusion
- Page 274 and 275: 22 nd Salt Water Intrusion Meeting:
- Page 276 and 277: 22 nd Salt Water Intrusion Meeting:
- Page 278 and 279: 22 nd Salt Water Intrusion Meeting:
- Page 280 and 281: 22 nd Salt Water Intrusion Meeting:
- Page 282 and 283: 22 nd Salt Water Intrusion Meeting:
- Page 284 and 285: 22 nd Salt Water Intrusion Meeting:
- Page 286 and 287: 22 nd Salt Water Intrusion Meeting:
- Page 288: 22 nd Salt Water Intrusion Meeting: