- Page 1 and 2: CHAPTER SNAPSHOTS2012CHAPTERS ANNUA
- Page 3 and 4: EXECUTIVE SUMMARYThere are 77 indiv
- Page 5 and 6: EXECUTIVE SUMMARYCommunity Building
- Page 7 and 8: CHAPTERS ANNUAL REPORT ANALYSISIntr
- Page 9 and 10: CHAPTERS ANNUAL REPORT ANALYSIS1.2
- Page 11 and 12: CHAPTERS ANNUAL REPORT ANALYSISTabl
- Page 13 and 14: CHAPTERS ANNUAL REPORT ANALYSISover
- Page 15 and 16: CHAPTERS ANNUAL REPORT ANALYSISMany
- Page 17 and 18: CHAPTERS ANNUAL REPORT ANALYSISTabl
- Page 19 and 20: CHAPTERS ANNUAL REPORT ANALYSISof t
- Page 21 and 22: CHAPTERS ANNUAL REPORT ANALYSISexpa
- Page 23 and 24: CHAPTERS ANNUAL REPORT ANALYSISAll
- Page 25 and 26: CHAPTERS ANNUAL REPORT ANALYSIS3.2
- Page 27 and 28: CHAPTERS ANNUAL REPORT ANALYSISOf i
- Page 29 and 30: CHAPTERS ANNUAL REPORT ANALYSISTabl
- Page 31 and 32: CHAPTERS ANNUAL REPORT ANALYSISTabl
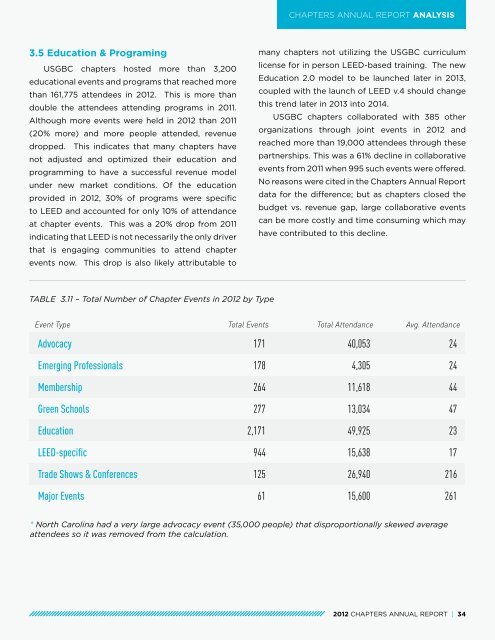
- Page 33: CHAPTERS ANNUAL REPORT ANALYSISInit
- Page 37 and 38: CHAPTERS ANNUAL REPORT ANALYSISLead
- Page 39 and 40: CHAPTERS ANNUAL REPORT ANALYSISTabl
- Page 41 and 42: CHAPTERS ANNUAL REPORT ANALYSIS4.4
- Page 43 and 44: CHAPTER SNAPSHOTSindividual Chapter
- Page 45 and 46: CHAPTER SNAPSHOTSAlabama CHAPTERSta
- Page 47 and 48: CHAPTER SNAPSHOTSEducation & Progra
- Page 49 and 50: CHAPTER SNAPSHOTSArizona CHAPTERSta
- Page 51 and 52: CHAPTER SNAPSHOTSEducation & Progra
- Page 53 and 54: CHAPTER SNAPSHOTSArkansas CHAPTERSt
- Page 55 and 56: CHAPTER SNAPSHOTSEducation & Progra
- Page 57 and 58: CHAPTER SNAPSHOTSCalifornia Central
- Page 59 and 60: CHAPTER SNAPSHOTSEducation & Progra
- Page 61 and 62: CHAPTER SNAPSHOTSCascadia GREEN BUI
- Page 63 and 64: CHAPTER SNAPSHOTSEducation & Progra
- Page 65 and 66: CHAPTER SNAPSHOTSCentral California
- Page 67 and 68: CHAPTER SNAPSHOTSEducation & Progra
- Page 69 and 70: CHAPTER SNAPSHOTSCentral Florida CH
- Page 71 and 72: CHAPTER SNAPSHOTSEducation & Progra
- Page 73 and 74: CHAPTER SNAPSHOTSCentral Ohio CHAPT
- Page 75 and 76: CHAPTER SNAPSHOTSEducation & Progra
- Page 77 and 78: CHAPTER SNAPSHOTSCentral Pennsylvan
- Page 79 and 80: CHAPTER SNAPSHOTSEducation & Progra
- Page 81 and 82: CHAPTER SNAPSHOTSCentral Plains CHA
- Page 83 and 84: CHAPTER SNAPSHOTSEducation & Progra
- Page 85 and 86:
CHAPTER SNAPSHOTSCentral TX-Balcone
- Page 87 and 88:
CHAPTER SNAPSHOTSEducation & Progra
- Page 89 and 90:
CHAPTER SNAPSHOTSChihuahan Desert C
- Page 91 and 92:
CHAPTER SNAPSHOTSEducation & Progra
- Page 93 and 94:
CHAPTER SNAPSHOTSCincinnati Regiona
- Page 95 and 96:
CHAPTER SNAPSHOTSEducation & Progra
- Page 97 and 98:
CHAPTER SNAPSHOTSColorado CHAPTERSt
- Page 99 and 100:
CHAPTER SNAPSHOTSEducation & Progra
- Page 101 and 102:
CHAPTER SNAPSHOTSConnecticut GREEN
- Page 103 and 104:
CHAPTER SNAPSHOTSEducation & Progra
- Page 105 and 106:
CHAPTER SNAPSHOTSDelaware Valley Gr
- Page 107 and 108:
CHAPTER SNAPSHOTSEducation & Progra
- Page 109 and 110:
CHAPTER SNAPSHOTSDetroit Regional C
- Page 111 and 112:
CHAPTER SNAPSHOTSEducation & Progra
- Page 113 and 114:
CHAPTER SNAPSHOTSEast Tennessee CHA
- Page 115 and 116:
CHAPTER SNAPSHOTSEducation & Progra
- Page 117 and 118:
CHAPTER SNAPSHOTSFlorida Capital Re
- Page 119 and 120:
CHAPTER SNAPSHOTSEducation & Progra
- Page 121 and 122:
CHAPTER SNAPSHOTSFlorida Gulf Coast
- Page 123 and 124:
CHAPTER SNAPSHOTSEducation & Progra
- Page 125 and 126:
CHAPTER SNAPSHOTSGeorgia CHAPTERSta
- Page 127 and 128:
CHAPTER SNAPSHOTSEducation & Progra
- Page 129 and 130:
CHAPTER SNAPSHOTSGreen Building All
- Page 131 and 132:
CHAPTER SNAPSHOTSEducation & Progra
- Page 133 and 134:
CHAPTER SNAPSHOTSHampton Roads Gree
- Page 135 and 136:
CHAPTER SNAPSHOTSEducation & Progra
- Page 137 and 138:
CHAPTER SNAPSHOTSHawaii CHAPTERStat
- Page 139 and 140:
CHAPTER SNAPSHOTSEducation & Progra
- Page 141 and 142:
CHAPTER SNAPSHOTSHeart of Florida C
- Page 143 and 144:
CHAPTER SNAPSHOTSEducation & Progra
- Page 145 and 146:
CHAPTER SNAPSHOTSIdaho CHAPTERState
- Page 147 and 148:
CHAPTER SNAPSHOTSEducation & Progra
- Page 149 and 150:
CHAPTER SNAPSHOTSIllinois CHAPTERSt
- Page 151 and 152:
CHAPTER SNAPSHOTSEducation & Progra
- Page 153 and 154:
CHAPTER SNAPSHOTSIndiana CHAPTERSta
- Page 155 and 156:
CHAPTER SNAPSHOTSEducation & Progra
- Page 157 and 158:
CHAPTER SNAPSHOTSInland Empire CHAP
- Page 159 and 160:
CHAPTER SNAPSHOTSEducation & Progra
- Page 161 and 162:
CHAPTER SNAPSHOTSIowa CHAPTERStatew
- Page 163 and 164:
CHAPTER SNAPSHOTSEducation & Progra
- Page 165 and 166:
CHAPTER SNAPSHOTSJames River Green
- Page 167 and 168:
CHAPTER SNAPSHOTSEducation & Progra
- Page 169 and 170:
CHAPTER SNAPSHOTSKentucky CHAPTERSt
- Page 171 and 172:
CHAPTER SNAPSHOTSEducation & Progra
- Page 173 and 174:
CHAPTER SNAPSHOTSLong Island CHAPTE
- Page 175 and 176:
CHAPTER SNAPSHOTSEducation & Progra
- Page 177 and 178:
CHAPTER SNAPSHOTSLos Angeles CHAPTE
- Page 179 and 180:
CHAPTER SNAPSHOTSEducation & Progra
- Page 181 and 182:
CHAPTER SNAPSHOTSLouisiana CHAPTERS
- Page 183 and 184:
CHAPTER SNAPSHOTSEducation & Progra
- Page 185 and 186:
CHAPTER SNAPSHOTSMaine CHAPTERState
- Page 187 and 188:
CHAPTER SNAPSHOTSEducation & Progra
- Page 189 and 190:
CHAPTER SNAPSHOTSMaryland CHAPTERSt
- Page 191 and 192:
CHAPTER SNAPSHOTSEducation & Progra
- Page 193 and 194:
CHAPTER SNAPSHOTSMassachusetts CHAP
- Page 195 and 196:
CHAPTER SNAPSHOTSEducation & Progra
- Page 197 and 198:
CHAPTER SNAPSHOTSMemphis Regional C
- Page 199 and 200:
CHAPTER SNAPSHOTSEducation & Progra
- Page 201 and 202:
CHAPTER SNAPSHOTSMiddle Tennessee C
- Page 203 and 204:
CHAPTER SNAPSHOTSEducation & Progra
- Page 205 and 206:
CHAPTER SNAPSHOTSMinnesota CHAPTERS
- Page 207 and 208:
CHAPTER SNAPSHOTSEducation & Progra
- Page 209 and 210:
CHAPTER SNAPSHOTSMississippi CHAPTE
- Page 211 and 212:
CHAPTER SNAPSHOTSEducation & Progra
- Page 213 and 214:
CHAPTER SNAPSHOTSMissouri Gateway C
- Page 215 and 216:
CHAPTER SNAPSHOTSEducation & Progra
- Page 217 and 218:
CHAPTER SNAPSHOTSMontana CHAPTERSta
- Page 219 and 220:
CHAPTER SNAPSHOTSEducation & Progra
- Page 221 and 222:
CHAPTER SNAPSHOTSNational Capital R
- Page 223 and 224:
CHAPTER SNAPSHOTSEducation & Progra
- Page 225 and 226:
CHAPTER SNAPSHOTSNebraska Flatwater
- Page 227 and 228:
CHAPTER SNAPSHOTSEducation & Progra
- Page 229 and 230:
CHAPTER SNAPSHOTSNevada CHAPTERStat
- Page 231 and 232:
CHAPTER SNAPSHOTSEducation & Progra
- Page 233 and 234:
CHAPTER SNAPSHOTSNew Hampshire CHAP
- Page 235 and 236:
CHAPTER SNAPSHOTSEducation & Progra
- Page 237 and 238:
CHAPTER SNAPSHOTSNew Jersey CHAPTER
- Page 239 and 240:
CHAPTER SNAPSHOTSEducation & Progra
- Page 241 and 242:
CHAPTER SNAPSHOTSNew Mexico CHAPTER
- Page 243 and 244:
CHAPTER SNAPSHOTSEducation & Progra
- Page 245 and 246:
CHAPTER SNAPSHOTSUrban Green New Yo
- Page 247 and 248:
CHAPTER SNAPSHOTSEducation & Progra
- Page 249 and 250:
CHAPTER SNAPSHOTSNew York Upstate C
- Page 251 and 252:
CHAPTER SNAPSHOTSEducation & Progra
- Page 253 and 254:
CHAPTER SNAPSHOTSNorth Carolina CHA
- Page 255 and 256:
CHAPTER SNAPSHOTSEducation & Progra
- Page 257 and 258:
CHAPTER SNAPSHOTSNorth Dakota Provi
- Page 259 and 260:
CHAPTER SNAPSHOTSEducation & Progra
- Page 261 and 262:
CHAPTER SNAPSHOTSNorth Florida CHAP
- Page 263 and 264:
CHAPTER SNAPSHOTSEducation & Progra
- Page 265 and 266:
CHAPTER SNAPSHOTSNorth Texas CHAPTE
- Page 267 and 268:
CHAPTER SNAPSHOTSEducation & Progra
- Page 269 and 270:
CHAPTER SNAPSHOTSNortheast Ohio CHA
- Page 271 and 272:
CHAPTER SNAPSHOTSEducation & Progra
- Page 273 and 274:
CHAPTER SNAPSHOTSNorthern Californi
- Page 275 and 276:
CHAPTER SNAPSHOTSEducation & Progra
- Page 277 and 278:
CHAPTER SNAPSHOTSNorthern Gulf Coas
- Page 279 and 280:
CHAPTER SNAPSHOTSEducation & Progra
- Page 281 and 282:
CHAPTER SNAPSHOTSNorthwest Ohio CHA
- Page 283 and 284:
CHAPTER SNAPSHOTSEducation & Progra
- Page 285 and 286:
CHAPTER SNAPSHOTSOklahoma CHAPTERSt
- Page 287 and 288:
CHAPTER SNAPSHOTSEducation & Progra
- Page 289 and 290:
CHAPTER SNAPSHOTSOrange County CHAP
- Page 291 and 292:
CHAPTER SNAPSHOTSEducation & Progra
- Page 293 and 294:
CHAPTER SNAPSHOTSRedwood Empire CHA
- Page 295 and 296:
CHAPTER SNAPSHOTSEducation & Progra
- Page 297 and 298:
CHAPTER SNAPSHOTSRhode Island CHAPT
- Page 299 and 300:
CHAPTER SNAPSHOTSEducation & Progra
- Page 301 and 302:
CHAPTER SNAPSHOTSSan Diego CHAPTERR
- Page 303 and 304:
CHAPTER SNAPSHOTSEducation & Progra
- Page 305 and 306:
CHAPTER SNAPSHOTSSouth Carolina CHA
- Page 307 and 308:
CHAPTER SNAPSHOTSEducation & Progra
- Page 309 and 310:
CHAPTER SNAPSHOTSSouth Dakota CHAPT
- Page 311 and 312:
CHAPTER SNAPSHOTSEducation & Progra
- Page 313 and 314:
CHAPTER SNAPSHOTSSouth Florida CHAP
- Page 315 and 316:
CHAPTER SNAPSHOTSEducation & Progra
- Page 317 and 318:
CHAPTER SNAPSHOTSSouthwest Virginia
- Page 319 and 320:
CHAPTER SNAPSHOTSEducation & Progra
- Page 321 and 322:
CHAPTER SNAPSHOTSTexas Gulf Coast C
- Page 323 and 324:
CHAPTER SNAPSHOTSEducation & Progra
- Page 325 and 326:
CHAPTER SNAPSHOTSU.S. Carribean CHA
- Page 327 and 328:
CHAPTER SNAPSHOTSEducation & Progra
- Page 329 and 330:
CHAPTER SNAPSHOTSUtah CHAPTERStatew
- Page 331 and 332:
CHAPTER SNAPSHOTSEducation & Progra
- Page 333 and 334:
CHAPTER SNAPSHOTSVermont Green Buil
- Page 335 and 336:
CHAPTER SNAPSHOTSEducation & Progra
- Page 337 and 338:
CHAPTER SNAPSHOTSWest Michigan CHAP
- Page 339 and 340:
CHAPTER SNAPSHOTSEducation & Progra
- Page 341 and 342:
CHAPTER SNAPSHOTSWest Virginia CHAP
- Page 343 and 344:
CHAPTER SNAPSHOTSEducation & Progra
- Page 345 and 346:
CHAPTER SNAPSHOTSWisconsin Green Bu
- Page 347 and 348:
CHAPTER SNAPSHOTSEducation & Progra
- Page 349 and 350:
CHAPTER SNAPSHOTSWyoming CHAPTERSta
- Page 351 and 352:
CHAPTER SNAPSHOTSEducation & Progra
- Page 353 and 354:
APPENDICESAppendix A.1: Chapter Cat
- Page 355 and 356:
APPENDICESSMALL chaptersChapterFoun
- Page 357 and 358:
APPENDICESChapterBudgetChapterBudge
- Page 359 and 360:
APPENDICESChapterBudgetChapterBudge
- Page 361 and 362:
APPENDICESMembershipThe minimum sta
- Page 363 and 364:
APPENDICESFinancials12. Filed state
- Page 365 and 366:
APPENDICESES2expFaciliteqFairmount
- Page 367 and 368:
APPENDICESTrane (5)Transwestern (2)
- Page 369 and 370:
APPENDICES2012 Grant supported prog
- Page 371 and 372:
APPENDICESAppendix D.2: USGBC Chapt
- Page 373 and 374:
APPENDICESAppendix E: Emerging Prof
- Page 375 and 376:
APPENDICES475 New EPs Recruited Aug
- Page 377 and 378:
APPENDICESChapter Q1 Q2 Q3 Q4 Total
- Page 379:
APPENDICESChapter Q1 Q2 Q3 Q4 Total