2003 Annual Report - Turkish Airlines
2003 Annual Report - Turkish Airlines
2003 Annual Report - Turkish Airlines

Create successful ePaper yourself
Turn your PDF publications into a flip-book with our unique Google optimized e-Paper software.
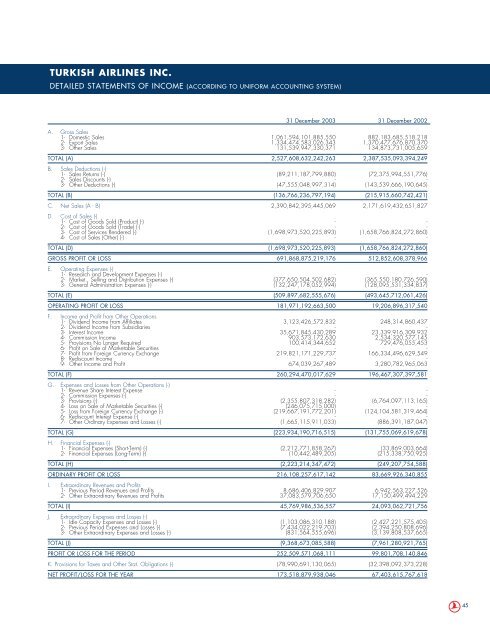
TURKISH AIRLINES INC.DETAILED STATEMENTS OF INCOME (ACCORDING TO UNIFORM ACCOUNTING SYSTEM)31 December <strong>2003</strong> 31 December 2002A. Gross Sales1- Domestic Sales 1,061,594,101,885,550 882,183,685,518,2182- Export Sales 1,334,474,583,026,343 1,370,477,676,870,3703- Other Sales 131,539,947,330,371 134,873,731,005,659TOTAL (A) 2,527,608,632,242,263 2,387,535,093,394,249B. Sales Deductions (-)1- Sales Returns (-) (89,211,187,799,880) (72,375,994,551,776)2- Sales Discounts (-) - -3- Other Deductions (-) (47,555,048,997,314) (143,539,666,190,645)TOTAL (B) (136,766,236,797,194) (215,915,660,742,421)C. Net Sales (A - B) 2,390,842,395,445,069 2,171,619,432,651,827D. Cost of Sales (-)1- Cost of Goods Sold (Product) (-) - -2- Cost of Goods Sold (Trade) (-) - -3- Cost of Services Rendered (-) (1,698,973,520,225,893) (1,658,766,824,272,860)4- Cost of Sales (Other) (-) - -TOTAL (D) (1,698,973,520,225,893) (1,658,766,824,272,860)GROSS PROFIT OR LOSS 691,868,875,219,176 512,852,608,378,966E. Operating Expenses (-)1- Research and Development Expenses (-) - -2- Market., Selling and Distribution Expenses (-) (377,650,504,502,682) (365,550,180,726,590)3- General Administration Expenses (-) (132,247,178,052,994) (128,095,531,334,837)TOTAL (E) (509,897,682,555,676) (493,645,712,061,426)OPERATING PROFIT OR LOSS 181,971,192,663,500 19,206,896,317,540F. Income and Profit from Other Operations1- Dividend Income from Affiliates 3,123,426,572,832 248,314,860,4372- Dividend Income from Subsidiaries - -3- Interest Income 35,671,845,430,289 23,339,916,309,9324- Commission Income 903,573,172,630 2,534,320,577,1455- Provisions No Longer Required 100,414,344,652 729,476,055,4536- Profit on Sale of Marketable Securities - -7- Profit from Foreign Currency Exchange 219,821,171,229,737 166,334,496,629,5498- Rediscount Income - -9- Other Income and Profit 674,039,267,489 3,280,782,965,063TOTAL (F) 260,294,470,017,629 196,467,307,397,581G. Expenses and Losses from Other Operations (-)1- Revenue Share Interest Expense - -2- Commission Expenses (-) - -3- Provisions (-) (2,355,807,318,282) (6,764,097,113,165)4- Loss on Sale of Marketable Securities (-) (246,075,715,000) -5- Loss from Foreign Currency Exchange (-) (219,667,191,772,201) (124,104,581,319,464)6- Rediscount Interest Expense (-) - -7- Other Ordinary Expenses and Losses (-) (1,665,115,911,033) (886,391,187,047)TOTAL (G) (223,934,190,716,515) (131,755,069,619,678)H. Financial Expenses (-)1- Financial Expenses (Short-Term) (-) (2,212,771,858,267) (33,869,003,664)2- Financial Expenses (Long-Term) (-) (10,442,489,205) (215,338,750,925)TOTAL (H) (2,223,214,347,472) (249,207,754,588)ORDINARY PROFIT OR LOSS 216,108,257,617,142 83,669,926,340,855I. Extraordinary Revenues and Profits1- Previous Period Revenues and Profits 8,686,406,829,907 6,942,563,227,5262- Other Extraordinary Revenues and Profits 37,083,579,706,650 17,150,499,494,229TOTAL (I) 45,769,986,536,557 24,093,062,721,756J. Extraordinary Expenses and Losses (-)1- Idle Capacity Expenses and Losses (-) (1,103,086,310,188) (2,427,221,575,405)2- Previous Period Expenses and Losses (-) (7,434,022,219,703) (2,394,250,808,696)3- Other Extraordinary Expenses and Losses (-) (831,564,555,696) (3,139,808,537,665)TOTAL (J) (9,368,673,085,588) (7,961,280,921,765)PROFIT OR LOSS FOR THE PERIOD 252,509,571,068,111 99,801,708,140,846K. Provisions for Taxes and Other Stat. Obligations (-) (78,990,691,130,065) (32,398,092,373,228)NET PROFIT/LOSS FOR THE YEAR 173,518,879,938,046 67,403,615,767,61845