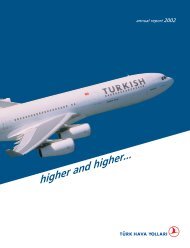
2003 Annual Report - Turkish Airlines
2003 Annual Report - Turkish Airlines
2003 Annual Report - Turkish Airlines

Create successful ePaper yourself
Turn your PDF publications into a flip-book with our unique Google optimized e-Paper software.
Financial FiguresProfit/Loss (TL millions)According to Uniform Accounting System1999 2000 2001 2002 <strong>2003</strong>Operating Revenues 541,672,304 959,662,893 1,665,236,226 2,171,619,433 2,390,842,395Operating Expenses 649,647,344 1,087,205,111 1,837,236,504 2,152,412,536 2,208,871,203Operating Profit/(Loss) (107,975,040) (127,542,218) (172,000,278) 19,206,896 181,971,193Revenue and Profit from Other Operations 38,408,599 35,728,573 159,125,631 196,467,307 260,294,470Expenses and Losses from Other Operations 5,301,600 8,719,398 31,845,838 131,755,070 223,934,191Financial Expenses 12,297,519 11,957,025 21,417,159 249,208 2,223,214Ordinary Profit/(Loss) (87,165,560) (112,490,068) (66,137,644) 83,669,926 216,108,258Extraordinary Revenues and Profits 40,032,779 61,312,556 111,054,387 24,093,063 45,769,987Extraordinary Expenses and Losses 20,381,596 12,856,882 24,973,439 7,961,281 9,368,673Provisions for Taxes - - - 32,398,092 78,990,691Net Profit/(Loss) (67,514,377) (64,034,394) 19,943,304 67,403,616 173,518,880Profit/Loss (TL millions)According to Capital Market Law Serial XI, Decree No:11999 2000 2001 2002Operating Revenues 541,672,304 959,662,893 1,665,236,225 2,255,511,670Operating Expenses 653,722,218 1,094,169,382 1,849,765,894 2,173,408,963Operating Profit/(Loss) (112,049,914) (134,506,489) (184,529,669) 82,102,707Revenue and Profit from Other Operations 38,319,322 34,724,275 158,920,291 200,298,421Expenses and Losses from Other Operations 4,042,760 7,240,369 31,253,906 124,593,621Financial Expenses 12,297,519 11,957,025 21,417,159 249,208Ordinary Profit/(Loss) (90,070,871) (118,979,608) (78,280,443) 157,558,299Extraordinary Revenues and Profits 40,122,056 62,316,854 111,381,184 27,201,800Extraordinary Expenses and Losses 20,381,594 12,856,882 24,973,438 47,442,683Provisions for Taxes - - - 32,398,092Net Profit/(Loss) (70,330,409) (69,519,636) 8,127,303 104,919,324Profit/Loss (TL millions)According to IFRS (All figures are restated to TL money values at December 31, <strong>2003</strong> pursuant to IAS 29)1999 2000 2001 2002 <strong>2003</strong>Operating Revenues 2,523,989,677 3,074,499,802 3,071,608,330 2,950,540,284 2,499,793,339Operating Expenses 2,902,389,840 3,362,536,635 2,972,408,926 2,567,609,822 2,174,674,745Operating Profit/(Loss) (378,400,163) (288,036,833) 99,199.404 382,930,462 325,118,594Income from Other Operations 110,401,096 111,133,743 221,632,579 43,699,711 89,948,593Loss from Other Operations 61,817,126 30,166,642 45,916,276 8,150,546 10,681,740Ordinary Profit/(Loss) (329,816,193) (207,069,732) 274,915,707 418,479,627 404,385,447Net Financial Revenue (979,859,566) (724,319,882) (2,266,353,888) (438,861,860) 259,735,872Monetary Gain/(Loss) 949,756,639 802,392,032 1,806,831,384 479,134,761 (376,874,468)Income Before Taxation (359,919,120) (128,997,582) (184,606,797) 458,752,528 287,246,851Tax Provisions 8,651,329 2,888,391 (8,929,353) (111,237,890) (73,386,988)Net Profit/(Loss) (351,267,791) (126,109,191) (193,536,150) 347,514,638 213,859,863Minority Shares (8,366,511) 5,993,782Net Profit/(Loss) (359,634,302) (120,115,409) (193,536,150) 347,514,638 213,859,863Exchange Rate, end of year (US$ 1.00) 540,098 671,765 1,439,567 1,634,501 1,395,835Exchange Rate, yearly average (US$ 1.00) 417,095 623,355 1,220,517 1,503,494 1,496,0887