2003 Annual Report - Turkish Airlines
2003 Annual Report - Turkish Airlines
2003 Annual Report - Turkish Airlines

You also want an ePaper? Increase the reach of your titles
YUMPU automatically turns print PDFs into web optimized ePapers that Google loves.
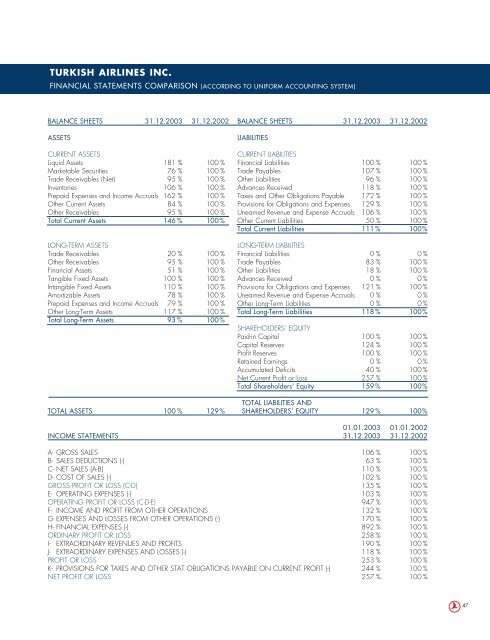
TURKISH AIRLINES INC.FINANCIAL STATEMENTS COMPARISON (ACCORDING TO UNIFORM ACCOUNTING SYSTEM)BALANCE SHEETS 31.12.<strong>2003</strong> 31.12.2002 BALANCE SHEETS 31.12.<strong>2003</strong> 31.12.2002ASSETSLIABILITIESCURRENT ASSETSCURRENT LIABILITIESLiquid Assets 181 % 100 % Financial Liabilities 100 % 100 %Marketable Securities 76 % 100 % Trade Payables 107 % 100 %Trade Receivables (Net) 95 % 100 % Other Liabilities 96 % 100 %Inventories 106 % 100 % Advances Received 118 % 100 %Prepaid Expenses and Income Accruals 162 % 100 % Taxes and Other Obligations Payable 172 % 100 %Other Current Assets 84 % 100 % Provisions for Obligations and Expenses 129 % 100 %Other Receivables 95 % 100 % Unearned Revenue and Expense Accruals 106 % 100 %Total Current Assets 146 % 100% Other Current Liabilities 50 % 100 %Total Current Liabilities 111 % 100%LONG-TERM ASSETSLONG-TERM LIABILITIESTrade Receivables 20 % 100 % Financial Liabilities 0 % 0 %Other Receivables 95 % 100 % Trade Payables 83 % 100 %Financial Assets 51 % 100 % Other Liabilities 18 % 100 %Tangible Fixed Assets 100 % 100 % Advances Received 0 % 0 %Intangible Fixed Assets 110 % 100 % Provisions for Obligations and Expenses 121 % 100 %Amortizable Assets 78 % 100 % Unearned Revenue and Expense Accruals 0 % 0 %Prepaid Expenses and Income Accruals 79 % 100 % Other Long-Term Liabilities 0 % 0 %Other Long-Term Assets 117 % 100 % Total Long-Term Liabilities 118 % 100%Total Long-Term Assets 93 % 100%SHAREHOLDERS' EQUITYPaid-in Capital 100 % 100 %Capital Reserves 124 % 100 %Profit Reserves 100 % 100 %Retained Earnings 0 % 0 %Accumulated Deficits 40 % 100 %Net Current Profit or Loss 257 % 100 %Total Shareholders' Equity 159 % 100%TOTAL LIABILITIES ANDTOTAL ASSETS 100 % 129% SHAREHOLDERS’ EQUITY 129 % 100%01.01.<strong>2003</strong> 01.01.2002INCOME STATEMENTS 31.12.<strong>2003</strong> 31.12.2002A- GROSS SALES 106 % 100 %B- SALES DEDUCTIONS (-) 63 % 100 %C- NET SALES (A-B) 110 % 100 %D- COST OF SALES (-) 102 % 100 %GROSS PROFIT OR LOSS (C-D) 135 % 100 %E- OPERATING EXPENSES (-) 103 % 100 %OPERATING PROFIT OR LOSS (C-D-E) 947 % 100 %F- INCOME AND PROFIT FROM OTHER OPERATIONS 132 % 100 %G- EXPENSES AND LOSSES FROM OTHER OPERATIONS (-) 170 % 100 %H- FINANCIAL EXPENSES (-) 892 % 100 %ORDINARY PROFIT OR LOSS 258 % 100 %I- EXTRAORDINARY REVENUES AND PROFITS 190 % 100 %J- EXTRAORDINARY EXPENSES AND LOSSES (-) 118 % 100 %PROFIT OR LOSS 253 % 100 %K- PROVISIONS FOR TAXES AND OTHER STAT OBLIGATIONS PAYABLE ON CURRENT PROFIT (-) 244 % 100 %NET PROFIT OR LOSS 257 % 100 %47