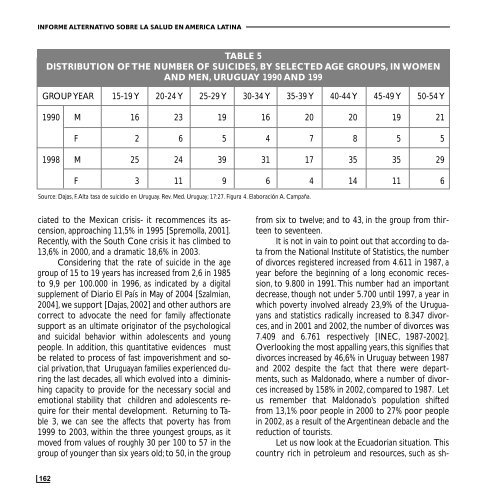
INFORME ALTERNATIVO SOBRE LA SALUD EN AMERICA LATINATABLE 5DISTRIBUTION OF THE NUMBER OF SUICIDES, BY SELECTED AGE GROUPS, IN WOMENAND MEN, URUGUAY 1990 AND 199GROUP YEAR15-19 Y20-24 Y25-29 Y30-34 Y35-39 Y40-44 Y45-49 Y50-54 Y1990 M1623191620201921F265478551998 M2524393117353529F31196414116Source: Dajas, F.Alta tasa <strong>de</strong> suicidio en Uruguay. Rev. Med. Uruguay; 17:27. Figura 4. Elaboración A. Campaña.ciated to the Mexican crisis- it recommences its ascension,approaching 11,5% in 1995 [Spremolla, 2001].Recently, with the South Cone crisis it has climbed to13,6% in 2000, and a dramatic 18,6% in 2003.Consi<strong>de</strong>ring that the rate of suici<strong>de</strong> in the agegroup of 15 to 19 years has increased from 2,6 in 1985to 9,9 per 100.000 in 1996, as indicated by a digitalsupplement of Diario El País in May of 2004 [Szalmian,2004], we support [Dajas, 2002] and other authors arecorrect to advocate the need for family affectionatesupport as an ultimate originator of the psychologicaland suicidal behavior within adolescents and youngpeople. In addition, this quantitative evi<strong>de</strong>nces mustbe related to process of fast impoverishment and socialprivation, that Uruguayan families experienced duringthe last <strong>de</strong>ca<strong>de</strong>s, all which evolved into a diminishingcapacity to provi<strong>de</strong> for the necessary social an<strong>de</strong>motional stability that children and adolescents requirefor their mental <strong>de</strong>velopment. Returning to Table3, we can see the affects that poverty has from1999 to 2003, within the three youngest groups, as itmoved from values of roughly 30 per 100 to 57 in thegroup of younger than six years old; to 50, in the groupfrom six to twelve; and to 43, in the group from thirteento seventeen.It is not in vain to point out that according to datafrom the National Institute of Statistics, the numberof divorces registered increased from 4.611 in 1987, ayear before the beginning of a long economic recession,to 9.800 in 1991.This number had an important<strong>de</strong>crease, though not un<strong>de</strong>r 5.700 until 1997, a year inwhich poverty involved already 23,9% of the Uruguayansand statistics radically increased to 8.347 divorces,and in 2001 and 2002, the number of divorces was7.409 and 6.761 respectively [INEC, 1987-2002].Overlooking the most appalling years, this signifies thatdivorces increased by 46,6% in Uruguay between 1987and 2002 <strong>de</strong>spite the fact that there were <strong>de</strong>partments,such as Maldonado, where a number of divorcesincreased by 158% in 2002, compared to 1987. Letus remember that Maldonado’s population shiftedfrom 13,1% poor people in 2000 to 27% poor peoplein 2002, as a result of the Argentinean <strong>de</strong>bacle and thereduction of tourists.Let us now look at the Ecuadorian situation. Thiscountry rich in petroleum and resources, such as sh-162
Observatorio Latinoamericano <strong>de</strong> Salud.rimp, banana and flowers, in the last years of the 1990’sfell into the <strong>de</strong>epest part of its economic crisis, correspondingto the period of structural adjustment policiesinitiated in 1982.In addition to the accumulation of problems producedby the payment of the external <strong>de</strong>bt (by 1999,nearly 16.000 million dollars), we must add the expendituresdue to the armed conflict of 1995 with Peru,the damages caused by the El Niño Phenomenon in1998 within its provinces of the Pacific Coast, the massivecorruption of state resource use by successive administrations,and the <strong>de</strong>vastating effect of the internationalfinancial crisis, which lead to the freezing of <strong>de</strong>posits,incontrollable inflation, monetary <strong>de</strong>preciation,capital flight, bankruptcy in banks, productive stagnation,and to the imposition of the dollarized system. Insuch circumstances, the <strong>de</strong>terioration of wages, unemployment,poverty, marginalization, and social inequitiesseverely increased to astonishing levels. Unemployment,which had remained for a long time atroughly 8% of the labor force, increased to 17% in1999.After finally rising and dropping, it established itselfat approximately 12%. Nevertheless, experts recommendus not to overlook the fact that since 1998,not less than a million Ecuadorians of working age migrated.Thus, the reductions in the rate of unemploymentare certainly not a product of the reactivation ofthe economic apparatus [Acosta, López Olivares & Villamar,2004]. In reference to the most conservativecalculations, the average national poverty has increasedfrom 56% in 1995 to nearly 65% in 2002. However,there are rural areas where poverty afflicts morethan 90% of the population. In brief, the countrystruggles in the middle of the uncertainties created bya strategy of economic stabilization and recovery,which is seemingly sustained by a few precarious factors,for instance the international high cost of petroleumand the volume, still elevated, of the migrants’ remittances.Table 6 reveals that Ecuador’s national rate ofsuici<strong>de</strong> increased from 2,8 to 4,6 per 100.000 between1980 and 2002. Actually, between 1980 and 1996, withthe exception of the Amazonic Province of Napo, inwhich the rate had a minimum diminution, all the otherprovinces display weighty upsurges. The dramaticincrease in Carchi, the frontier province with Colombia,draws our attention. After being the one withnearly non-existent suici<strong>de</strong> (0,7 per 100.000) in 1980,it un<strong>de</strong>rwent an increase of almost twenty-one timesand consequently reached the highest value of thecountry (14,5 per 100.000) in 1996. And further, itcontinued (10,1 per 100.000) within the group of provincesto reach even higher suici<strong>de</strong> rates in 2002.Though on a lower scale, another province thatpresents a notable increment in the suici<strong>de</strong> rate is Bolivar.It reached 6,8 per 100.000, eleven times greaterin 1996 than in 1980, maintaining a <strong>de</strong>finitely high rateof 6,2 in 2002. The comparison of 1996 and 2002 ratespresents ten provinces tending towards reduction,and eight tending to an increase of suici<strong>de</strong>s.Among theones with increasing ten<strong>de</strong>ncy, the case of Cañar andZamora Chinchipe are impressive. The first is a provincewith a high <strong>de</strong>gree of migration, redoubled evenmore by the 2000 crisis. It has passed from 5,8 suici<strong>de</strong>sper 100.000 to 10,2 in 2002; the second is an Amazonicprovince, which has elevated its rate from 4,4 to11,1 in only six years. Taken from 2002 data, threegroups clearly differentiated by provinces are takingshape. The one with rate lower than 4 per 100.000:Galápagos, El Oro, Guayas, Los Ríos and Pichincha. Thegroup with an intermediate rate, from 4 to 8 per100.000: Manabí, Imbabura, Loja, Sucumbios, Chimborazo,Bolívar, Pastaza, Cotopaxi,Azuay,Tungurahua andNapo. And the group with the most elevated rate, 8per 100.000: Esmeraldas, Morona Santiago, Orellana,Carchi, Cañar and Zamora Chinchipe (table 6).Thus, all the arguments and information we haveestablished along these pages subtitled Evi<strong>de</strong>nce for a163