Food Security Atlas Of RURAL MAHARASHTRA - WFP Remote ...
Food Security Atlas Of RURAL MAHARASHTRA - WFP Remote ...
Food Security Atlas Of RURAL MAHARASHTRA - WFP Remote ...

You also want an ePaper? Increase the reach of your titles
YUMPU automatically turns print PDFs into web optimized ePapers that Google loves.
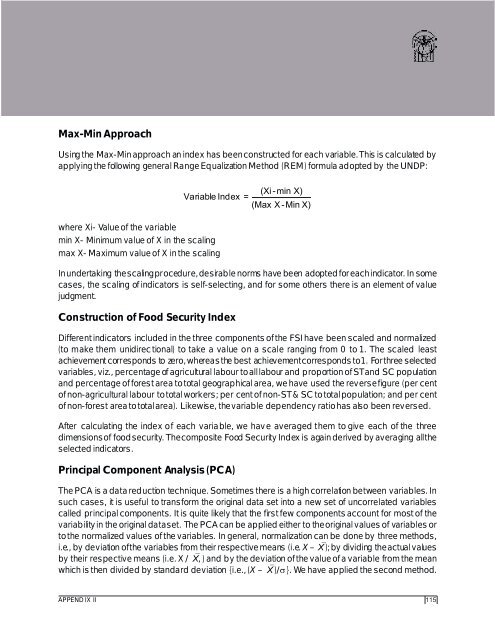
Max-Min ApproachUsing the Max-Min approach an index has been constructed for each variable. This is calculated byapplying the following general Range Equalization Method (REM) formula adopted by the UNDP:(Xi -min X)Variable Index =(Max X -Min X)where Xi- Value of the variablemin X- Minimum value of X in the scalingmax X- Maximum value of X in the scalingIn undertaking the scaling procedure, desirable norms have been adopted for each indicator. In somecases, the scaling of indicators is self-selecting, and for some others there is an element of valuejudgment.Construction of <strong>Food</strong> <strong>Security</strong> IndexDifferent indicators included in the three components of the FSI have been scaled and normalized(to make them unidirec tional) to take a value on a scale ranging from 0 to 1. The scaled leastachievement corresponds to zero, whereas the best achievement corresponds to 1. For three selectedvariables, viz., percentage of agricultural labour to all labour and proportion of ST and SC populationand percentage of forest area to total geographical area, we have used the reverse figure (per centof non-agricultural labour to total workers; per cent of non-ST & SC to total population; and per centof non-forest area to total area). Likewise, the variable dependency ratio has also been reversed.After calculating the index of each variable, we hav e averaged them to give each of the threedimensions of food security. The composite <strong>Food</strong> <strong>Security</strong> Index is again derived by averaging all theselected indicators.Principal Component Analysis (PCA)The PCA is a data reduction technique. Sometimes there is a high correlation between variables. Insuch cases, it is useful to transform the original data set into a new set of uncorrelated variablescalled principal components. It is quite likely that the first few components account for most of thevariability in the original data set. The PCA can be applied either to the original values of variables orto the normalized values of the variables. In general, normalization can be done by three methods,i.e., by deviation of the variables from their respective means (i.e. X –X ); by dividing the actual valuesby their respective means (i.e. X /X, ) and by the deviation of the value of a variable from the meanwhich is then divided by standard deviation {i.e., (X –X )/ }. We have applied the second method.APPEND IX II115