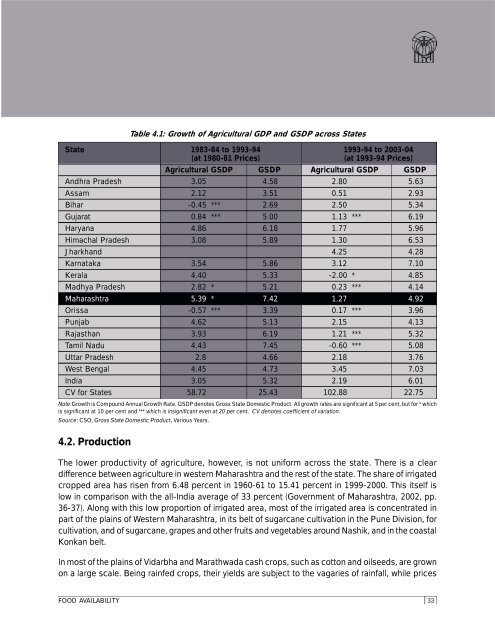
4. <strong>Food</strong> Availability4. <strong>Food</strong> AvailabilityThe concern for food availability stems from production and related aspects that sustain a desiredlevel of food production. Where production is largely for subsistence and is the main source of ahousehold’s food entitlement, foodgrain production is of paramount significance for household foodand nutritional security. <strong>Food</strong>grains are also the cheapest source of energy and proteins comparedto other foods, and are indispensable for the food security of the lower income groups (Chand andKumar, 2006).In the context of stagnant yields of foodgrain production, use of food crops for biofuel production,diversion of crop land to biofuel cultivation, falling carrying capacity of land, environmental andsustainability issues and global warming directly affect agricultural production. All of this manifestedin rising international prices of food which makes, increasing availability of food a matter of urgentglobal concern. Global climate change, in particular could have a critical impact on agriculturalproduction. Empirical evidence shows that an increase in temperature affects crop production bothdirectly and indirectly. It has been estimated that cereal yields in tropical regions, such as India, aregoing to decline for even a marginal increase (1-2 o C) in temperatures (IPCC, 2007). A great deal ofresearch is needed to understand this impact in different states of the country.This chapter analyses food availability across a number of component dimensions. Broadly thesedimensions are production and productivity, extent of irrigation, proportion of forests, and roadconnectivity. The effort is to compare the overall situation in Maharashtra vis-à-vis other States, andthen analyze and map the inter-district disparities. The chapter also shows the position of each districtwith respect to the selected indicators and the composite index and map of availability.4.1 Agricultural GrowthReflecting the deepening agrarian crisis in the country, growth in agricultural Gross State DomesticProduct (GSDP) in India declined during the decade 1993-94 to 2003-04 as compared to the precedingdecade (see Table 4.1).While agricultural GDP grew at a very slow rate of about 3 percent during the decade 1983–84 to1993–94, it came down even further to 2.2 percent in the next period from 1993–94 to 2003–04. Inthe same period, the disparities among the states also widened. The coefficient of variation in thegrowth of agricultural GDP, which is a measure of the disparities among states, increased significantlyfrom 59 to 103 over the two periods. At the same time, there was a decline in the variation acrossstates in the growth of overall GDP (Table 4.1).Maharashtra witnessed a positive growth of 5.39 percent in agricultural GSDP during 1983-84 to1993-94. However, it witnessed a decline during 1993-94 to 2003-04 (largely on account of a highbase). Similarly, the growth rate of GSDP has also declined during the same period.32 FOOD SECURITY ATLAS OF <strong>RURAL</strong> <strong>MAHARASHTRA</strong>
4.2. ProductionTable 4.1: Growth of Agricultural GDP and GSDP across StatesState 1983-84 to 1993-94 1993-94 to 2003-04(at 1980-81 Prices)(at 1993-94 Prices)Agricultural GSDP GSDP Agricultural GSDP GSDPAndhra Pradesh 3.05 4.58 2.80 5.63Assam 2.12 3.51 0.51 2.93Bihar -0.45 *** 2.69 2.50 5.34Gujarat 0.84 *** 5.00 1.13 *** 6.19Haryana 4.86 6.18 1.77 5.96Himachal Pradesh 3.08 5.89 1.30 6.53Jharkhand 4.25 4.28Karnataka 3.54 5.86 3.12 7.10Kerala 4.40 5.33 -2.00 * 4.85Madhya Pradesh 2.82 * 5.21 0.23 *** 4.14Maharashtra 5.39 * 7.42 1.27 4.92Orissa -0.57 *** 3.39 0.17 *** 3.96Punjab 4.62 5.13 2.15 4.13Rajasthan 3.93 6.19 1.21 *** 5.32Tamil Nadu 4.43 7.45 -0.60 *** 5.08Uttar Pradesh 2.8 4.66 2.18 3.76West Bengal 4.45 4.73 3.45 7.03India 3.05 5.32 2.19 6.01CV for States 58.72 25.43 102.88 22.75Note:Growth is Compound Annual Growth Rate. GSDP denotes Gross State Domestic Product. All growth rates are significant at 5 per cent, but for * whichis significant at 10 per cent and *** which is insignificant even at 20 per cent. CV denotes coefficient of variation.Source: CSO, Gross State Domestic Product, Various Years.The lower productivity of agriculture, however, is not uniform across the state. There is a cleardifference between agriculture in western Maharashtra and the rest of the state. The share of irrigatedcropped area has risen from 6.48 percent in 1960-61 to 15.41 percent in 1999-2000. This itself islow in comparison with the all-India average of 33 percent (Government of Maharashtra, 2002, pp.36-37). Along with this low proportion of irrigated area, most of the irrigated area is concentrated inpart of the plains of Western Maharashtra, in its belt of sugarcane cultivation in the Pune Division, forcultivation, and of sugarcane, grapes and other fruits and vegetables around Nashik, and in the coastalKonkan belt.In most of the plains of Vidarbha and Marathwada cash crops, such as cotton and oilseeds, are grownon a large scale. Being rainfed crops, their yields are subject to the vagaries of rainfall, while pricesFOOD AVAILABILITY33
- Page 1 and 2:
Food Security AtlasOfRURAL MAHARASH
- Page 3 and 4: Copyright © 2010The UN World Food
- Page 5 and 6: TECHNICAL ADVISORY GROUPChairperson
- Page 8: PrefaceIndia is home to more than a
- Page 12 and 13: ContentsForewardPrefaceAcknowledgem
- Page 14 and 15: List of Tables, Figures, Maps and B
- Page 16 and 17: List of AbbreviationsADAPTAIDISAPLA
- Page 19 and 20: Executive SummaryExecutive SummaryF
- Page 21 and 22: capacities and knowledge.Measures t
- Page 24 and 25: 1. Introduction1. IntroductionIndia
- Page 26 and 27: production. This portion of the con
- Page 28: other states in the country. In lin
- Page 31 and 32: Map 2.1: Maharashtra: Administrativ
- Page 33 and 34: Table 2.2: Percentage Poverty Rates
- Page 35 and 36: Table 2.6: Sectoral Composition of
- Page 37 and 38: Table 2.8: Mortality and Nutritiona
- Page 39: Table 2.11: Status of ConsumptionPe
- Page 42 and 43: Children who are more than two stan
- Page 44 and 45: Map 3.1: Food Security Outcome Map
- Page 46 and 47: Table 3.3: Indicators used to Compu
- Page 48 and 49: the ‘normal’ entitlements to fo
- Page 50 and 51: to the dependent population 1 . Thi
- Page 52: Table 3.4: Indicators Used to Analy
- Page 57 and 58: Box 4.1: Agricultural Production an
- Page 59 and 60: Table 4.4: Extent of Irrigation in
- Page 61 and 62: The state has a modest coverage (15
- Page 63 and 64: Map 4.4: Status of Rural Connectivi
- Page 65 and 66: Table 4.8: Indicators Used in Const
- Page 68 and 69: 5. Access to Food5. Access to FoodT
- Page 70 and 71: Table 5.2: Rural Casual Wage Rate b
- Page 72 and 73: 5.3. Agricultural LabourersMaharash
- Page 74 and 75: Table 5.7: Proportion of Scheduled
- Page 76 and 77: Table 5.9: Ratio of Working Age Pop
- Page 78 and 79: Table 5.11: Rural Female Literacy b
- Page 80 and 81: poor food security situation. In Ma
- Page 82 and 83: Table 5.14: Urbanization in Maharas
- Page 84 and 85: This re gional patter n of migratio
- Page 87 and 88: 6. Food Absorption6. Food Absorptio
- Page 89: Map 6.1: Access to Health Services
- Page 92: Map 6.3: Food Absorption Map of Rur
- Page 95 and 96: Table 7.1: Ranks of Districts on Co
- Page 97 and 98: Map 7.2: Maharashtra: Priority Dist
- Page 99 and 100: e improved through better rural con
- Page 101 and 102: Box 7.1: National Policy for Farmer
- Page 103 and 104:
A part of the wastelands has also b
- Page 105 and 106:
development policy for forest-dwell
- Page 107 and 108:
Table 7.6: Index of Public Interven
- Page 109 and 110:
Table 7.7: MGNREGS Performance, All
- Page 111 and 112:
Another policy implication from the
- Page 113 and 114:
The list of activities taken up und
- Page 115 and 116:
Box 7.5: The Forest Rights ActThe S
- Page 117 and 118:
women’s land rights also increase
- Page 119 and 120:
Box 7.6: Ralegan Siddhi: A Village
- Page 121 and 122:
may not be a corresponding improvem
- Page 123:
Infants and Young ChildrenBox 7.8:
- Page 126 and 127:
frequent disruption in the supply o
- Page 128 and 129:
panchayats, the panchayats perform
- Page 130:
Table 8.1: Key Interventions in Pri
- Page 133 and 134:
Government of India (2007a), The Sc
- Page 135:
Srivastava, Ravi, 1997, “Rural La
- Page 138 and 139:
Thus, rights require state action w
- Page 140:
obligation of the state to provide
- Page 143 and 144:
Name of Variable and Description So
- Page 145 and 146:
The basic objective of using PCA is
- Page 147 and 148:
Appendix III: Index Value, Normativ
- Page 149 and 150:
Table A3.3:Index Values and Normati
- Page 151:
The Food Security Atlas of Rural Ma