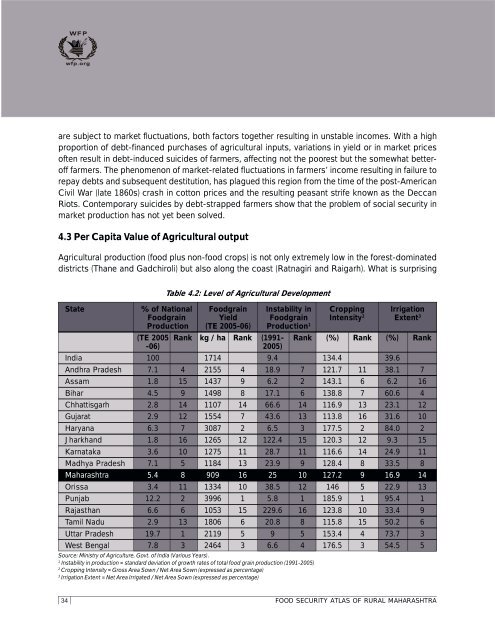
are subject to market fluctuations, both factors together resulting in unstable incomes. With a highproportion of debt-financed purchases of agricultural inputs, variations in yield or in market pricesoften result in debt-induced suicides of farmers, affecting not the poorest but the somewhat betterofffarmers. The phenomenon of market-related fluctuations in farmers’ income resulting in failure torepay debts and subsequent destitution, has plagued this region from the time of the post-AmericanCivil War (late 1860s) crash in cotton prices and the resulting peasant strife known as the DeccanRiots. Contemporary suicides by debt-strapped farmers show that the problem of social security inmarket production has not yet been solved.4.3 Per Capita Value of Agricultural outputAgricultural production (food plus non-food crops) is not only extremely low in the forest-dominateddistricts (Thane and Gadchiroli) but also along the coast (Ratnagiri and Raigarh). What is surprisingTable 4.2: Level of Agricultural DevelopmentState % of National <strong>Food</strong>grain Instability in Cropping Irrigation<strong>Food</strong>grain Yield <strong>Food</strong>grain Intensity 2 Extent 3Production (TE 2005-06) Production 1(TE 2005 Rank kg / ha Rank (1991- Rank (%) Rank (%) Rank-06) 2005)India 100 1714 9.4 134.4 39.6Andhra Pradesh 7.1 4 2155 4 18.9 7 121.7 11 38.1 7Assam 1.8 15 1437 9 6.2 2 143.1 6 6.2 16Bihar 4.5 9 1498 8 17.1 6 138.8 7 60.6 4Chhattisgarh 2.8 14 1107 14 66.6 14 116.9 13 23.1 12Gujarat 2.9 12 1554 7 43.6 13 113.8 16 31.6 10Haryana 6.3 7 3087 2 6.5 3 177.5 2 84.0 2Jharkhand 1.8 16 1265 12 122.4 15 120.3 12 9.3 15Karnataka 3.6 10 1275 11 28.7 11 116.6 14 24.9 11Madhya Pradesh 7.1 5 1184 13 23.9 9 128.4 8 33.5 8Maharashtra 5.4 8 909 16 25 10 127.2 9 16.9 14Orissa 3.4 11 1334 10 38.5 12 146 5 22.9 13Punjab 12.2 2 3996 1 5.8 1 185.9 1 95.4 1Rajasthan 6.6 6 1053 15 229.6 16 123.8 10 33.4 9Tamil Nadu 2.9 13 1806 6 20.8 8 115.8 15 50.2 6Uttar Pradesh 19.7 1 2119 5 9 5 153.4 4 73.7 3West Bengal 7.8 3 2464 3 6.6 4 176.5 3 54.5 5Source: Ministry of Agriculture, Govt. of India (Various Years).1Instability in production = standard deviation of growth rates of total food grain production (1991-2005)2Cropping Intensity = Gross Area Sown / Net Area Sown (expressed as percentage)3Irrigation Extent = Net Area Irrigated / Net Area Sown (expressed as percentage)34 FOOD SECURITY ATLAS OF <strong>RURAL</strong> <strong>MAHARASHTRA</strong>
Box 4.1: Agricultural Production and <strong>Food</strong> <strong>Security</strong>It is commonly believed that agricultural production directly affects food security. However, there is more to it than a mere directlink. Rising agricultural productivity increases rural incomes and lowers food prices, making food more accessible to the poor.Improving irrigational facilities and growing drought-tolerant crops reduce income variability by mitigating the impact of drought.Productivity enhancements are key to greater food security for households with limited access to food markets. Nutritionallyenriched crops give access to better diets, particularly through biofortification that substantially improves the nutrient content ofthe crop.Thus investments in agriculture are important to ensure food security. However, there is an increasing concern about global foodsecurity in future, largely consequent upon growing resource scarcity and climate change. In the present world, many countrieshave diversified their export base, and trade at large stabilizes food availability. However, food availability is still a concern inmany agriculture-based countries. Many countries have declining per capita production of food staples. Further, staple cropproduction in most of these countries is rain-fed and experiences large fluctuations caused by climatic variability.The increase or even sustenance of the present level of production is limited by a number of factors – land constraints, waterscarcity, high energy prices – along with the uncertain effects of climate change, which has been considered to be one of theareas of greatest uncertainties for agriculture. The combined effects of higher average temperatures, greater variability oftemperature and precipitation, more frequent and intense droughts and floods and reduced availability of water for irrigation canbe devastating for agriculture, particularly in the tropical regions. It has been predicted that agricultural GDP in Sub-SaharanAfrica could contract by anywhere from 2 to 9 percent.Source: World Development Report, 2008is that Ahmadnagar, Solapur and Nanded, with relatively high irrigation, are in the very low productioncategory, along with Nandurbar. These districts combine irrigation (largely for sugarcane production)in limited parts of the district, along with the rest of the district carrying out rainfed agriculture, producingTable 4.3: Per Capita Value of Agricultural Output in MaharashtraDistrict Value Rank District Value Rank District Value Rank(%) (%) (%)Ahmadnagar 865 28 Hingoli 2933 3 Pune 1121 23Akola 2368 7 Jalgaon 2193 8 Raigarh 841 29Amravati 1906 11 Jalna 2651 5 Ratnagiri 608 33Aurangabad 1579 19 Kolhapur 2406 6 Sangli 1753 16Bhandara 1090 24 Latur 1839 14 Satara 1458 20Bid 1823 15 Nagpur 1870 13 Sindhudurg 1297 22Buldana 2120 9 Nanded 1873 12 Solapur 957 26Chandrapur 1592 18 Nandurbar 1073 25 Thane 609 32Dhule 1454 21 Nashik 908 27 Wardha 3077 2Gadchiroli 682 31 Osmanabad 1677 17 Washim 2917 4Gondiya 817 30 Parbhani 3318 1 Yavatmal 2092 10Source: As stated in Table 3.4, Variable a2.FOOD AVAILABILITY35
- Page 1 and 2:
Food Security AtlasOfRURAL MAHARASH
- Page 3 and 4:
Copyright © 2010The UN World Food
- Page 5 and 6: TECHNICAL ADVISORY GROUPChairperson
- Page 8: PrefaceIndia is home to more than a
- Page 12 and 13: ContentsForewardPrefaceAcknowledgem
- Page 14 and 15: List of Tables, Figures, Maps and B
- Page 16 and 17: List of AbbreviationsADAPTAIDISAPLA
- Page 19 and 20: Executive SummaryExecutive SummaryF
- Page 21 and 22: capacities and knowledge.Measures t
- Page 24 and 25: 1. Introduction1. IntroductionIndia
- Page 26 and 27: production. This portion of the con
- Page 28: other states in the country. In lin
- Page 31 and 32: Map 2.1: Maharashtra: Administrativ
- Page 33 and 34: Table 2.2: Percentage Poverty Rates
- Page 35 and 36: Table 2.6: Sectoral Composition of
- Page 37 and 38: Table 2.8: Mortality and Nutritiona
- Page 39: Table 2.11: Status of ConsumptionPe
- Page 42 and 43: Children who are more than two stan
- Page 44 and 45: Map 3.1: Food Security Outcome Map
- Page 46 and 47: Table 3.3: Indicators used to Compu
- Page 48 and 49: the ‘normal’ entitlements to fo
- Page 50 and 51: to the dependent population 1 . Thi
- Page 52: Table 3.4: Indicators Used to Analy
- Page 55: 4.2. ProductionTable 4.1: Growth of
- Page 59 and 60: Table 4.4: Extent of Irrigation in
- Page 61 and 62: The state has a modest coverage (15
- Page 63 and 64: Map 4.4: Status of Rural Connectivi
- Page 65 and 66: Table 4.8: Indicators Used in Const
- Page 68 and 69: 5. Access to Food5. Access to FoodT
- Page 70 and 71: Table 5.2: Rural Casual Wage Rate b
- Page 72 and 73: 5.3. Agricultural LabourersMaharash
- Page 74 and 75: Table 5.7: Proportion of Scheduled
- Page 76 and 77: Table 5.9: Ratio of Working Age Pop
- Page 78 and 79: Table 5.11: Rural Female Literacy b
- Page 80 and 81: poor food security situation. In Ma
- Page 82 and 83: Table 5.14: Urbanization in Maharas
- Page 84 and 85: This re gional patter n of migratio
- Page 87 and 88: 6. Food Absorption6. Food Absorptio
- Page 89: Map 6.1: Access to Health Services
- Page 92: Map 6.3: Food Absorption Map of Rur
- Page 95 and 96: Table 7.1: Ranks of Districts on Co
- Page 97 and 98: Map 7.2: Maharashtra: Priority Dist
- Page 99 and 100: e improved through better rural con
- Page 101 and 102: Box 7.1: National Policy for Farmer
- Page 103 and 104: A part of the wastelands has also b
- Page 105 and 106: development policy for forest-dwell
- Page 107 and 108:
Table 7.6: Index of Public Interven
- Page 109 and 110:
Table 7.7: MGNREGS Performance, All
- Page 111 and 112:
Another policy implication from the
- Page 113 and 114:
The list of activities taken up und
- Page 115 and 116:
Box 7.5: The Forest Rights ActThe S
- Page 117 and 118:
women’s land rights also increase
- Page 119 and 120:
Box 7.6: Ralegan Siddhi: A Village
- Page 121 and 122:
may not be a corresponding improvem
- Page 123:
Infants and Young ChildrenBox 7.8:
- Page 126 and 127:
frequent disruption in the supply o
- Page 128 and 129:
panchayats, the panchayats perform
- Page 130:
Table 8.1: Key Interventions in Pri
- Page 133 and 134:
Government of India (2007a), The Sc
- Page 135:
Srivastava, Ravi, 1997, “Rural La
- Page 138 and 139:
Thus, rights require state action w
- Page 140:
obligation of the state to provide
- Page 143 and 144:
Name of Variable and Description So
- Page 145 and 146:
The basic objective of using PCA is
- Page 147 and 148:
Appendix III: Index Value, Normativ
- Page 149 and 150:
Table A3.3:Index Values and Normati
- Page 151:
The Food Security Atlas of Rural Ma