Raman Spectroscopy of nanomaterials - institut de chimie et des ...
Raman Spectroscopy of nanomaterials - institut de chimie et des ...
Raman Spectroscopy of nanomaterials - institut de chimie et des ...

You also want an ePaper? Increase the reach of your titles
YUMPU automatically turns print PDFs into web optimized ePapers that Google loves.
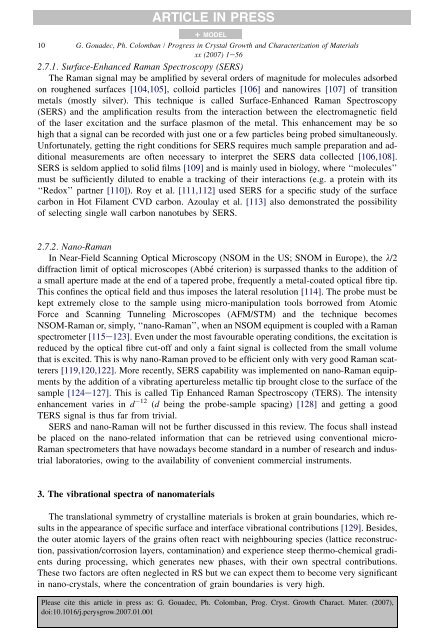
ARTICLE IN PRESS+ MODEL10 G. Goua<strong>de</strong>c, Ph. Colomban / Progress in Crystal Growth and Characterization <strong>of</strong> Materialsxx (2007) 1e562.7.1. Surface-Enhanced <strong>Raman</strong> <strong>Spectroscopy</strong> (SERS)The <strong>Raman</strong> signal may be amplified by several or<strong>de</strong>rs <strong>of</strong> magnitu<strong>de</strong> for molecules adsorbedon roughened surfaces [104,105], colloid particles [106] and nanowires [107] <strong>of</strong> transitionm<strong>et</strong>als (mostly silver). This technique is called Surface-Enhanced <strong>Raman</strong> <strong>Spectroscopy</strong>(SERS) and the amplification results from the interaction b<strong>et</strong>ween the electromagn<strong>et</strong>ic field<strong>of</strong> the laser excitation and the surface plasmon <strong>of</strong> the m<strong>et</strong>al. This enhancement may be sohigh that a signal can be recor<strong>de</strong>d with just one or a few particles being probed simultaneously.Unfortunately, g<strong>et</strong>ting the right conditions for SERS requires much sample preparation and additionalmeasurements are <strong>of</strong>ten necessary to interpr<strong>et</strong> the SERS data collected [106,108].SERS is seldom applied to solid films [109] and is mainly used in biology, where ‘‘molecules’’must be sufficiently diluted to enable a tracking <strong>of</strong> their interactions (e.g. a protein with its‘‘Redox’’ partner [110]). Roy <strong>et</strong> al. [111,112] used SERS for a specific study <strong>of</strong> the surfacecarbon in Hot Filament CVD carbon. Azoulay <strong>et</strong> al. [113] also <strong>de</strong>monstrated the possibility<strong>of</strong> selecting single wall carbon nanotubes by SERS.2.7.2. Nano-<strong>Raman</strong>In Near-Field Scanning Optical Microscopy (NSOM in the US; SNOM in Europe), the l/2diffraction limit <strong>of</strong> optical microscopes (Abbé criterion) is surpassed thanks to the addition <strong>of</strong>a small aperture ma<strong>de</strong> at the end <strong>of</strong> a tapered probe, frequently a m<strong>et</strong>al-coated optical fibre tip.This confines the optical field and thus imposes the lateral resolution [114]. The probe must bekept extremely close to the sample using micro-manipulation tools borrowed from AtomicForce and Scanning Tunneling Microscopes (AFM/STM) and the technique becomesNSOM-<strong>Raman</strong> or, simply, ‘‘nano-<strong>Raman</strong>’’, when an NSOM equipment is coupled with a <strong>Raman</strong>spectrom<strong>et</strong>er [115e123]. Even un<strong>de</strong>r the most favourable operating conditions, the excitation isreduced by the optical fibre cut-<strong>of</strong>f and only a faint signal is collected from the small volum<strong>et</strong>hat is excited. This is why nano-<strong>Raman</strong> proved to be efficient only with very good <strong>Raman</strong> scatterers[119,120,122]. More recently, SERS capability was implemented on nano-<strong>Raman</strong> equipmentsby the addition <strong>of</strong> a vibrating apertureless m<strong>et</strong>allic tip brought close to the surface <strong>of</strong> thesample [124e127]. This is called Tip Enhanced <strong>Raman</strong> <strong>Spectroscopy</strong> (TERS). The intensityenhancement varies in d 12 (d being the probe-sample spacing) [128] and g<strong>et</strong>ting a goodTERS signal is thus far from trivial.SERS and nano-<strong>Raman</strong> will not be further discussed in this review. The focus shall insteadbe placed on the nano-related information that can be r<strong>et</strong>rieved using conventional micro-<strong>Raman</strong> spectrom<strong>et</strong>ers that have nowadays become standard in a number <strong>of</strong> research and industriallaboratories, owing to the availability <strong>of</strong> convenient commercial instruments.3. The vibrational spectra <strong>of</strong> <strong>nanomaterials</strong>The translational symm<strong>et</strong>ry <strong>of</strong> crystalline materials is broken at grain boundaries, which resultsin the appearance <strong>of</strong> specific surface and interface vibrational contributions [129]. Besi<strong>de</strong>s,the outer atomic layers <strong>of</strong> the grains <strong>of</strong>ten react with neighbouring species (lattice reconstruction,passivation/corrosion layers, contamination) and experience steep thermo-chemical gradientsduring processing, which generates new phases, with their own spectral contributions.These two factors are <strong>of</strong>ten neglected in RS but we can expect them to become very significantin nano-crystals, where the concentration <strong>of</strong> grain boundaries is very high.Please cite this article in press as: G. Goua<strong>de</strong>c, Ph. Colomban, Prog. Cryst. Growth Charact. Mater. (2007),doi:10.1016/j.pcrysgrow.2007.01.001