Raman Spectroscopy of nanomaterials - institut de chimie et des ...
Raman Spectroscopy of nanomaterials - institut de chimie et des ...
Raman Spectroscopy of nanomaterials - institut de chimie et des ...

Create successful ePaper yourself
Turn your PDF publications into a flip-book with our unique Google optimized e-Paper software.
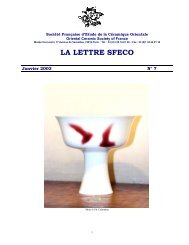
ARTICLE IN PRESS+ MODELG. Goua<strong>de</strong>c, Ph. Colomban / Progress in Crystal Growth and Characterization <strong>of</strong> Materialsxx (2007) 1e56ν D / cm -113571347NLMairredHi– air716661Linewidth / cm -14313371.2 1.7 2.2 2.7Strength / GPa56Annealed FibersCrystallineAs-receivedAmorphousFig. 25. <strong>Raman</strong> shift and linewidth <strong>of</strong> the carbon D mo<strong>de</strong> (l ¼ 514.5 nm) plotted as a function <strong>of</strong> tensile strengths foundin Berger <strong>et</strong> al. [383] or Kumagawa <strong>et</strong> al. [370] for heat-treated SiC fibres. Reprinted from Ref. [38, pp. 1249e1259]with permission from Elsevier.With this form, the quasi-harmonic approximation (Eqs. (37) and (38)) leads to:sffiffiffiffiffiffiffiffiffiffiffiffiffiffiffiffiffiffiffiffiffiffiffiffiffiffiffiffiffiffiffiffiffiffiffiffiffiffiffiffiffiffiffiffiffiffiffiffiffinðl b Þf k b 1 þ k0 bðl b l 0 Þk bð55Þwhere k 0 b is expected to be much smaller than k so, as long as l b remains close to l 0 (small strainassumption), a Taylor expansion is justified:pnðl b Þwffiffiffiffi k 0bk b þ pffiffiffiffiðl b l 0 Þ ð56Þk bnðl b2 Þnðl b1 Þwp k0b ffiffiffiffi ðl b2 l b1 Þ ð57Þk bUpon comparison with Eq. (50), this is equivalent to:S 3 b ¼ k0 b l 0p100 ffiffiffiffi < 0 ð58Þk bHere again, we find that the energy shift for a strained bond can be expected to be proportionalto the bond <strong>de</strong>formation. Besi<strong>de</strong>s, in such isotropic structures as most nanophased fibresare, the ‘‘bond compression mo<strong>de</strong>l’’ predicts a Young’s modulus in the following form [490]:E ¼ X bondsl 2 b k b9ð59ÞFor fibres with a single (or dominant) type <strong>of</strong> bonds, k b and kb 0 have unique values and, accordingto Eqs. (58) and (59), S 3 b must then be proportional to E 1/2 and the same will apply toS 3 (see discussion <strong>of</strong> Eqs. (49) and (50)). Fig. 26 plots S 3 G coefficient measured in different carbonand ‘‘first generation’’ SiC fibres as a function <strong>of</strong> Young’s modulus square root. The proportionand the distribution <strong>of</strong> the carbon and SiC phases differ in the fibres and, y<strong>et</strong>, a globalclassification is possible. Note that a direct proportionality b<strong>et</strong>ween S 3 and E has been reportedPlease cite this article in press as: G. Goua<strong>de</strong>c, Ph. Colomban, Prog. Cryst. Growth Charact. Mater. (2007),doi:10.1016/j.pcrysgrow.2007.01.001