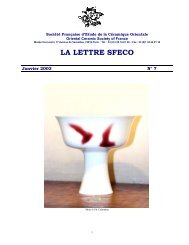
ARTICLE IN PRESS+ MODEL8 G. Goua<strong>de</strong>c, Ph. Colomban / Progress in Crystal Growth and Characterization <strong>of</strong> Materialsxx (2007) 1e562.5. Resonant <strong>Raman</strong> <strong>Spectroscopy</strong> (RRS)If the energy <strong>of</strong> the laser excitation (usually in the UV-nIR range) is high enough to approachthose <strong>of</strong> the various electronic states <strong>of</strong> the material (in other words if the material is coloured),<strong>Raman</strong> spectra may be mingled with photoluminescence spectra arising from excited electroniclevels. The consequence is the strong enhancement <strong>of</strong> some vibrational mo<strong>de</strong>s (near-resonance/resonance <strong>Raman</strong> scattering) but one should notice that the probed chemical bonds are ina markedly disturbed state [22,26,27,76e78]. The light pen<strong>et</strong>ration is reduced to a few tens<strong>of</strong> nanom<strong>et</strong>ers only (Dz coloured in Fig. 2b), which makes mRS a good m<strong>et</strong>hod for surface analysis[23,79]. 7 If films or fibre-reinforced composites ma<strong>de</strong> <strong>of</strong> absorbent materials are polished withsurface to growth direction and surface to fibre axis angles slightly different from, respectively,90 and 0 , then in-line scans <strong>of</strong> the samples provi<strong>de</strong> high spatial resolution across the filmthickness [83e85] or the fibreematrix contact region (interphase) [22].The pen<strong>et</strong>ration <strong>de</strong>pth d <strong>of</strong> the light is directly related to the wavelength-<strong>de</strong>pen<strong>de</strong>nt coefficient<strong>of</strong> linear absorption a l (cm 1 ):d ¼ l excitation4pnk ¼ 1a l ðlÞð8ÞIn Eq. (8), n and k are, respectively, the refraction and extinction in<strong>de</strong>xes. The pen<strong>et</strong>ration<strong>de</strong>pth d is in<strong>de</strong>terminate in the (frequent) lack <strong>of</strong> absorption coefficients but switching excitationwavelengths close to the electronic absorption threshold can help separate surface frombulk <strong>Raman</strong> contributions [37]. This is illustrated in Fig. 4, where polyaniline fibres spectrarecor<strong>de</strong>d with red, green and blue laser lines, are compared [86]. The bottom spectrum correspondsto the surface <strong>of</strong> these fibres (maximum electronic absorption) where a ‘‘type I’’monoclinic form <strong>of</strong> polyaniline is dominant [87]. By contrast, the bulk <strong>of</strong> the fibre (as seenwith blue excitation on the top spectrum) contains more <strong>of</strong> the type II orthorhombic form. Followingthe same principle, Shen and Pollak [49] and Yakimova <strong>et</strong> al. [48] used multiple laserlines to measure spectra at different <strong>de</strong>pths below the surface <strong>of</strong> semiconductor films.Note that when the absorption is very high, the temperature may rise at the point <strong>of</strong> laser impact,even for a few mW/mm 2 irradiation. This effect is reduced if the sample is either dispersed in a nonabsorbingmatrix, put in a rotating cell or observed in a low temperature cryostat but <strong>of</strong>ten results ina wavenumber shift or even a chemical <strong>de</strong>gradation <strong>of</strong> the sample (oxidation, <strong>de</strong>composition, <strong>et</strong>c.).It is then mandatory to calibrate the thermal effects [88e90]. Besi<strong>de</strong>s, whenever the absorbingphase is not dispersed in a transparent matrix, a significant part <strong>of</strong> the scattered light intensitymay be reabsorbed.2.6. Analysis <strong>of</strong> ‘‘isolated’’ units: the molecular schemeEq. (4) corresponds to a <strong>de</strong>scription where the vibrations in the solids are pictured as collectivewaves but another <strong>de</strong>scription is possible for solids with different bond strengths. In this ‘‘molecular’’<strong>de</strong>scription, clusters <strong>of</strong> strong covalent bonds are isolated from one another by weaker ionicbonds and, thus, become the relevant vibrational unit (localized vibrations). All atoms from thisunit must exclusively belong to it (including, for example, oxygen atoms from polymerised7 Resonance <strong>Raman</strong> spectra recor<strong>de</strong>d with different wavelengths <strong>of</strong> excitation are also a way <strong>of</strong> characterizing excitonsand polarons in semiconductors [80,81] and conducting polymers [82].Please cite this article in press as: G. Goua<strong>de</strong>c, Ph. Colomban, Prog. Cryst. Growth Charact. Mater. (2007),doi:10.1016/j.pcrysgrow.2007.01.001
ARTICLE IN PRESS+ MODELG. Goua<strong>de</strong>c, Ph. Colomban / Progress in Crystal Growth and Characterization <strong>of</strong> Materialsxx (2007) 1e569148457.9 nmII form (+ I)90193514.5 nm : I+II forms90120150195647.1 nm : I form85120oxi<strong>de</strong>s) for the normal coordinates <strong>of</strong> Eqs. (2) and (3) to coinci<strong>de</strong> with given bond lengths and bondangles. The spectra then reveal str<strong>et</strong>ching and bending mo<strong>de</strong>s equivalent to those <strong>of</strong> polyhedral(mostly t<strong>et</strong>rahedral or octahedral) isolated molecules [91e94]. The difference arises from the cationsgenerating T 0 (translational) and R 0 (rotational) libration mo<strong>de</strong>s. The molecular scheme notonly <strong>de</strong>scribes most organic polymers but also crystalline/amorphous inorganic polymers such assilicates, phosphates, niobiates, titanates [95e97] and all compounds with polyatomic cationssuch as NH 4 þ ,H 3 O þ or N 2 H 5 2þ [50, p. 379]. A given vibration then always appears in the same region,its exact position giving information about the local environment <strong>of</strong> the correspondingbonds, both in the crystalline and amorphous states [93,98e103]. Y<strong>et</strong>, these bonds are probedwith a 1 mm 2 section beam, which means one g<strong>et</strong>s only an average view over their distribution.2.7. ‘‘Nano-specific’’ mo<strong>de</strong>s1992970 100 200 300Fig. 4. <strong>Raman</strong> spectra recor<strong>de</strong>d on polyaniline/camphor sulfonic acid fibres. The use <strong>of</strong> three different excitation wavelengthsmodifies the probing <strong>de</strong>pth (Adapted from Ref. [86, pp. 215e220]).There are two ways <strong>of</strong> truly isolating the <strong>Raman</strong> signal coming from nano-particles. One isby having a nano-particle to be the only one <strong>of</strong> its kind in the laser’s path (SERS) while theother involves a breaking <strong>of</strong> the l/2 diffraction limit <strong>of</strong> optical microscopes (nano-<strong>Raman</strong>).Please cite this article in press as: G. Goua<strong>de</strong>c, Ph. Colomban, Prog. Cryst. Growth Charact. Mater. (2007),doi:10.1016/j.pcrysgrow.2007.01.001