Raman Spectroscopy of nanomaterials - institut de chimie et des ...
Raman Spectroscopy of nanomaterials - institut de chimie et des ...
Raman Spectroscopy of nanomaterials - institut de chimie et des ...

Create successful ePaper yourself
Turn your PDF publications into a flip-book with our unique Google optimized e-Paper software.
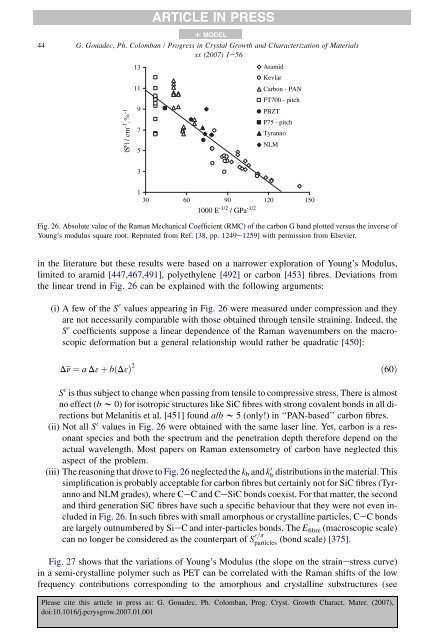
|S ε | / cm -1 . -11311975ARTICLE IN PRESS+ MODEL44 G. Goua<strong>de</strong>c, Ph. Colomban / Progress in Crystal Growth and Characterization <strong>of</strong> Materialsxx (2007) 1e56AramidKevlarCarbon - PANFT700 - pitchPBZTP75 - pitchTyrannoNLM3130 60 90 120 1501000 E -1/2 / GPa -1/2Fig. 26. Absolute value <strong>of</strong> the <strong>Raman</strong> Mechanical Coefficient (RMC) <strong>of</strong> the carbon G band plotted versus the inverse <strong>of</strong>Young’s modulus square root. Reprinted from Ref. [38, pp. 1249e1259] with permission from Elsevier.in the literature but these results were based on a narrower exploration <strong>of</strong> Young’s Modulus,limited to aramid [447,467,491], poly<strong>et</strong>hylene [492] or carbon [453] fibres. Deviations fromthe linear trend in Fig. 26 can be explained with the following arguments:(i) A few <strong>of</strong> the S 3 values appearing in Fig. 26 were measured un<strong>de</strong>r compression and theyare not necessarily comparable with those obtained through tensile straining. In<strong>de</strong>ed, theS 3 coefficients suppose a linear <strong>de</strong>pen<strong>de</strong>nce <strong>of</strong> the <strong>Raman</strong> wavenumbers on the macroscopic<strong>de</strong>formation but a general relationship would rather be quadratic [450]:Dn ¼ a D3 þ bðD3Þ 2ð60ÞS 3 is thus subject to change when passing from tensile to compressive stress. There is almostno effect (b w 0) for isotropic structures like SiC fibres with strong covalent bonds in all directionsbut Melanitis <strong>et</strong> al. [451] found a/b w 5 (only!) in ‘‘PAN-based’’ carbon fibres.(ii) Not all S 3 values in Fig. 26 were obtained with the same laser line. Y<strong>et</strong>, carbon is a resonantspecies and both the spectrum and the pen<strong>et</strong>ration <strong>de</strong>pth therefore <strong>de</strong>pend on theactual wavelength. Most papers on <strong>Raman</strong> extensom<strong>et</strong>ry <strong>of</strong> carbon have neglected thisaspect <strong>of</strong> the problem.(iii) The reasoning that drove to Fig. 26 neglected the k b and kb 0 distributions in the material. Thissimplification is probably acceptable for carbon fibres but certainly not for SiC fibres (Tyrannoand NLM gra<strong>de</strong>s), where CeC and CeSiC bonds coexist. For that matter, the secondand third generation SiC fibres have such a specific behaviour that they were not even inclu<strong>de</strong>din Fig. 26. In such fibres with small amorphous or crystalline particles, CeC bondsare largely outnumbered by SieC and inter-particles bonds. The E fibre (macroscopic scale)can no longer be consi<strong>de</strong>red as the counterpart <strong>of</strong> S 3=sparticles(bond scale) [375].Fig. 27 shows that the variations <strong>of</strong> Young’s Modulus (the slope on the strainestress curve)in a semi-crystalline polymer such as PET can be correlated with the <strong>Raman</strong> shifts <strong>of</strong> the lowfrequency contributions corresponding to the amorphous and crystalline substructures (seePlease cite this article in press as: G. Goua<strong>de</strong>c, Ph. Colomban, Prog. Cryst. Growth Charact. Mater. (2007),doi:10.1016/j.pcrysgrow.2007.01.001