PDF Document 2.46 MB - Geveko
PDF Document 2.46 MB - Geveko
PDF Document 2.46 MB - Geveko

You also want an ePaper? Increase the reach of your titles
YUMPU automatically turns print PDFs into web optimized ePapers that Google loves.
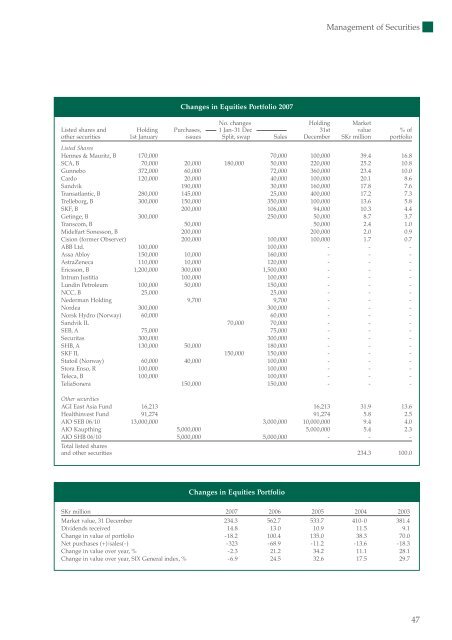
Management of SecuritiesChanges in Equities Portfolio 2007No. changes Holding MarketListed shares and Holding Purchases, 1 Jan-31 Dec 31st value % ofother securities 1st January issues Split, swap Sales December SKr million portfolioListed SharesHennes & Mauritz, B 170,000 70,000 100,000 39.4 16.8SCA, B 70,000 20,000 180,000 50,000 220,000 25.2 10.8Gunnebo 372,000 60,000 72,000 360,000 23.4 10.0Cardo 120,000 20,000 40,000 100,000 20.1 8.6Sandvik 190,000 30,000 160,000 17.8 7.6Transatlantic, B 280,000 145,000 25,000 400,000 17.2 7.3Trelleborg, B 300,000 150,000 350,000 100,000 13.6 5.8SKF, B 200,000 106,000 94,000 10.3 4.4Getinge, B 300,000 250,000 50,000 8.7 3.7Transcom, B 50,000 50,000 2.4 1.0Midelfart Sonesson, B 200,000 200,000 2.0 0.9Cision (former Observer) 200,000 100,000 100,000 1.7 0.7ABB Ltd. 100,000 100,000 - - -Assa Abloy 150,000 10,000 160,000 - - -AstraZeneca 110,000 10,000 120,000 - - -Ericsson, B 1,200,000 300,000 1,500,000 - - -Intrum Justitia 100,000 100,000 - - -Lundin Petroleum 100,000 50,000 150,000 - - -NCC, B 25,000 25,000 - - -Nederman Holding 9,700 9,700 - - -Nordea 300,000 300,000 - - -Norsk Hydro (Norway) 60,000 60,000 - - -Sandvik IL 70,000 70,000 - - -SEB, A 75,000 75,000 - - -Securitas 300,000 300,000 - - -SHB, A 130,000 50,000 180,000 - - -SKF IL 150,000 150,000 - - -Statoil (Norway) 60,000 40,000 100,000 - - -Stora Enso, R 100,000 100,000 - - -Teleca, B 100,000 100,000 - - -TeliaSonera 150,000 150,000 - - -Other securitiesAGI East Asia Fund 16,213 16,213 31.9 13.6Healthinvest Fund 91,274 91,274 5.8 2.5AIO SEB 06/10 13,000,000 3,000,000 10,000,000 9.4 4.0AIO Kaupthing 5,000,000 5,000,000 5.4 2.3AIO SHB 06/10 5,000,000 5,000,000 - - -Total listed sharesand other securities 234.3 100.0Changes in Equities PortfolioSKr million 2007 2006 2005 2004 2003Market value, 31 December 234.3 562.7 533.7 410-0 381.4Dividends received 14.8 13.0 10.9 11.5 9.1Change in value of portfolio -18.2 100.4 135.0 38.3 70.0Net purchases (+)/sales(-) -323 -68.9 -11.2 -13.6 -18.3Change in value over year, % -2.3 21.2 34.2 11.1 28.1Change in value over year, SIX General index, % -6.9 24.5 32.6 17.5 29.747