284 <strong>Vauxhall</strong> <strong>Nine</strong> <strong>Elms</strong> <strong>Battersea</strong> <strong>Opportunity</strong> <strong>Area</strong> <strong>Planning</strong> <strong>Framework</strong>3.2 Development phasingThe OAPF considers development of the areain 2 principle phases as follows:Phase 1 2006-16Phase 2 2017-26Current estimates are for slightly moredevelopment overall in Phase 1 than Phase2, with a bias towards residential and retailin Phase 1 and commercial/industrial inPhase 2. The mix expected in each phase issummarised below. Phasing has an impacton the development of an area wide networkdue to the risk associated with the timing offuture revenues streams. Taking a modularapproach and phasing the installation of lowcarbon plant within energy centres generallymitigate this.PhaseTotal gross floorarea (sqm)Residential area(sqm)Retail area(sqm)Office area(sqm)Industrial area(sqm)Phase 1 921,741 703,780 131,250 46,711 40,000Phase 2 805,829 468,790 18,750 308,289 10,000Total 1,727,570 1,172,570 150,000 355,000 50,000Table 2However, some up front fixed costsassociated with the district heatingdistribution network and energy centrestructures and services can not be avoidedand will tend to result in a capital intensivescheme which requires support in the shortto medium term whilst the connectedload builds.3.3 Energy demand andconsumption estimatesIn order to analyse the expected energydemand and annual consumption arisingfrom the new developments planned in theOA and further understand the opportunityfor district heating, the OA has beendivided into 5 areas. The areas and thecorresponding LTS zones, which they fallwithin, are as follows:• Albert Embankment (LTS Zones 107,1200, 1204)• <strong>Vauxhall</strong> (1206)• NCGM Environs + Patmore Estates (1300)• BPS District + <strong>Nine</strong> <strong>Elms</strong> District (1301)• Stewarts Road Industrial <strong>Area</strong> (1310)Estimates of peak demand and annualenergy consumption have been madeusing benchmarks, taking account of thephasing of development and future expectedreductions in demand and consumptionas changes to the Building Regulationsare implemented. The following tablessummarise the results of this exercise andshow estimates of total annual energy (heat,cooling and electricity) consumption andpeak demand for new developments in eachof the above areas once fully built out i.e.Phases 1 and 2.
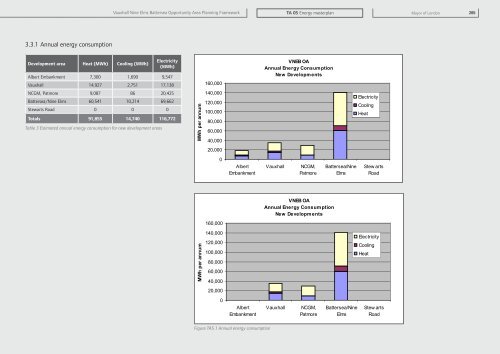
<strong>Vauxhall</strong> <strong>Nine</strong> <strong>Elms</strong> <strong>Battersea</strong> <strong>Opportunity</strong> <strong>Area</strong> <strong>Planning</strong> <strong>Framework</strong>TA 05 Energy masterplanMayor of London 2853.3.1 Annual energy consumptionDevelopment area Heat (MWh) Cooling (MWh)Electricity(MWh)Albert Embankment 7,300 1,690 9,547<strong>Vauxhall</strong> 14,927 2,751 17,138160,000VNEB OAAnnual Energy ConsumptionNew DevelopmentsNCGM, Patmore 9,087 86 20,425<strong>Battersea</strong>/<strong>Nine</strong> <strong>Elms</strong> 60,541 10,214 69,662Stewarts Road 0 0 0Totals 91,855 14,740 116,772Table 3 Estimated annual energy consumption for new development areasMWh per annum140,000120,000100,00080,00060,00040,000ElectricityCoolingHeat20,0000AlbertEmbankment<strong>Vauxhall</strong>NCGM,Patmore<strong>Battersea</strong>/<strong>Nine</strong><strong>Elms</strong>Stew artsRoadVNEB OAAnnual Energy ConsumptionNew Developments160,000MWh per annum140,000120,000100,00080,00060,00040,000ElectricityCoolingHeat20,0000AlbertEmbankment<strong>Vauxhall</strong>NCGM,Patmore<strong>Battersea</strong>/<strong>Nine</strong><strong>Elms</strong>Stew artsRoadFigure TA5.1 Annual energy consumption