8 MB - POWERLAB
8 MB - POWERLAB
8 MB - POWERLAB

Create successful ePaper yourself
Turn your PDF publications into a flip-book with our unique Google optimized e-Paper software.
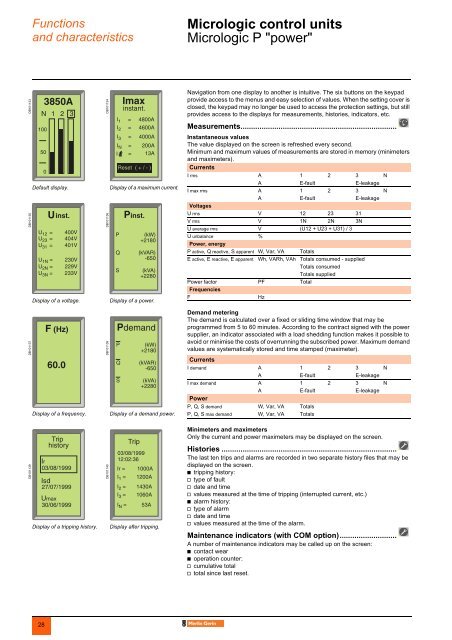
Functionsand characteristicsMicrologic control units 0Micrologic P "power"DB101133DB101134Navigation from one display to another is intuitive. The six buttons on the keypadprovide access to the menus and easy selection of values. When the setting cover isclosed, the keypad may no longer be used to access the protection settings, but stillprovides access to the displays for measurements, histories, indicators, etc.DB101135Default display.Display of a voltage.DB101136Display of a maximum current.Display of a power.Measurements..........................................................................Instantaneous valuesThe value displayed on the screen is refreshed every second.Minimum and maximum values of measurements are stored in memory (minimetersand maximeters).CurrentsI rms A 1 2 3 NA E-fault E-leakageI max rms A 1 2 3 NA E-fault E-leakageVoltagesU rms V 12 23 31V rms V 1N 2N 3NU average rms V (U12 + U23 + U31) / 3U unbalance %Power, energyP active, Q reactive, S apparent W, Var, VA TotalsE active, E reactive, E apparent Wh, VARh, VAh Totals consumed - suppliedTotals consumedTotals suppliedPower factor PF TotalFrequenciesFHzDB101137Display of a frequency.DB101138Display of a demand power.Demand meteringThe demand is calculated over a fixed or sliding time window that may beprogrammed from 5 to 60 minutes. According to the contract signed with the powersupplier, an indicator associated with a load shedding function makes it possible toavoid or minimise the costs of overrunning the subscribed power. Maximum demandvalues are systematically stored and time stamped (maximeter).CurrentsI demand A 1 2 3 NA E-fault E-leakageI max demand A 1 2 3 NA E-fault E-leakagePowerP, Q, S demand W, Var, VA TotalsP, Q, S max demand W, Var, VA TotalsMinimeters and maximetersOnly the current and power maximeters may be displayed on the screen.DB101139Display of a tripping history.DB101140Display after tripping.Histories ...................................................................................The last ten trips and alarms are recorded in two separate history files that may bedisplayed on the screen.b tripping history:v type of faultv date and timev values measured at the time of tripping (interrupted current, etc.)b alarm history:v type of alarmv date and timev values measured at the time of the alarm.Maintenance indicators (with COM option)...........................A number of maintenance indicators may be called up on the screen:b contact wearb operation counter:v cumulative totalv total since last reset.28