

Final Report (PDF, 2132K) - Measure DHS
Final Report (PDF, 2132K) - Measure DHS
Final Report (PDF, 2132K) - Measure DHS

You also want an ePaper? Increase the reach of your titles
YUMPU automatically turns print PDFs into web optimized ePapers that Google loves.
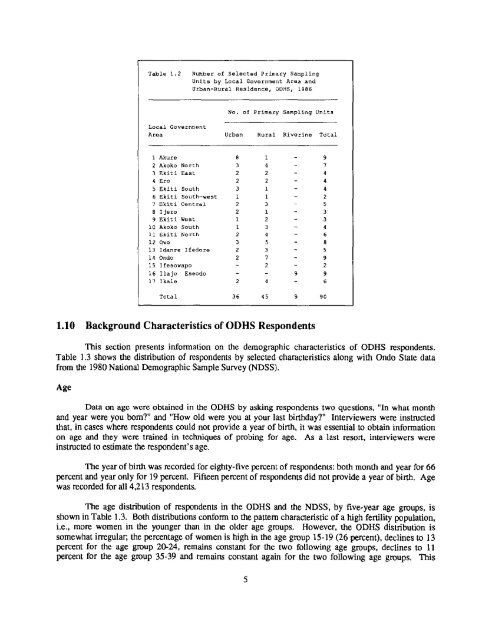
Table 1.2Number of Selected Primary SamplingUnits by Local Government Area andUrban-Rural Residence, O<strong>DHS</strong>, 1986No. of Primary Sampling UnitsLocal GovernmentArea Urban Rural Riverine Totali Akure 8 1 92 Akoko North 3 4 73 Ekiti East 2 2 44 Ere 2 2 45 Ekiti South 3 1 46 Ekiti South-west 1 1 27 Ekiti Central 2 3 58 lJero 2 1 39 Ekiti West 1 2 3I0 Akoko South 1 3 4]i Ekiti North 2 4 612 Owe 3 5 813 Idanre Ifedore 2 3 514 Ondo 2 7 915 Ifesowapo 2 216 Ilaje Eseodo 9 9]7 Ikale 2 4 6Total 36 45 9 901.10 Background Characteristics of O<strong>DHS</strong> RespondentsThis section presents information on the demographic characteristics of O<strong>DHS</strong> respondents.Table 1.3 shows the distribution of respondents by selected characteristics along with Ondo State datafrom the 1980 National Demographic Sample Survey (NDSS).AgeData on age were obtained in the O<strong>DHS</strong> by asking respondents two questions, "In what monthand year were you bom?" and "How old were you at your last birthday?" Interviewers were instructedthat, in cases where respondents could not provide a year of birth, it was essential to obtain informationon age and they were trained in techniques of probing for age. As a last resort, interviewers wereinstructed to estimate the respondent's age.The year of birth was recorded for eighty-five percent of respondents: both month and year for 66percent and year only for 19 percent. Fifteen percent of respondents did not provide a year of birth. Agewas recorded for all 4,213 respondents.The age distribution of respondents in the O<strong>DHS</strong> and the NDSS, by five-year age groups, isshown in Table 1.3. Both distributions conform to the pattem characteristic of a high fertility population,i.e., more women in the younger than in the older age groups. However, the O<strong>DHS</strong> distribution issomewhat irregular; the percentage of women is high in the age group 15-19 (26 percent), declines to 13percent for the age group 20-24, remains constant for the two following age groups, declines to 11percent for the age group 35-39 and remains constant again for the two following age groups. This


![Obtaining Informed Consent for HIV Testing [QRS4] - Measure DHS](https://img.yumpu.com/49850117/1/190x245/obtaining-informed-consent-for-hiv-testing-qrs4-measure-dhs.jpg?quality=85)


