

Final Report (PDF, 2132K) - Measure DHS
Final Report (PDF, 2132K) - Measure DHS
Final Report (PDF, 2132K) - Measure DHS

You also want an ePaper? Increase the reach of your titles
YUMPU automatically turns print PDFs into web optimized ePapers that Google loves.
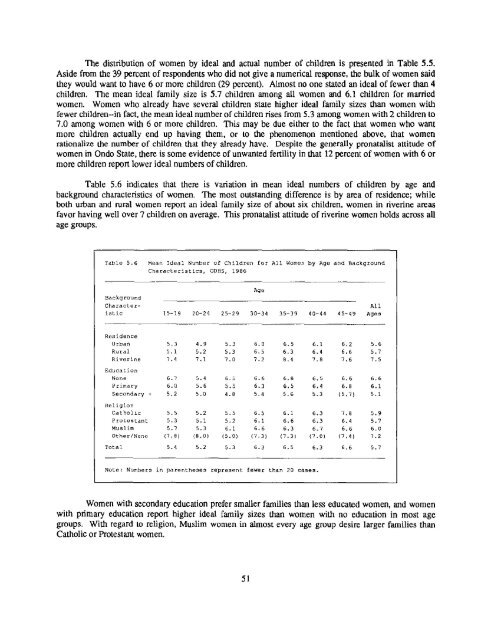
The distribution of women by ideal and actual number of children is presented in Table 5.5.Aside from the 39 percent of respondents who did not give a numerical response, the bulk of women saidthey would want to have 6 or more children (29 percent). Almost no one stated an ideal of fewer than 4children. The mean ideal family size is 5.7 children among all women and 6.1 children for marriedwomen. Women who already have several children state higher ideal family sizes than women withfewer children--in fact, the mean ideal number of children rises from 5.3 among women with 2 children to7.0 among women with 6 or more children. This may be due either to the fact that women who wantmore children actually end up having them, or to the phenomenon mentioned above, that womenrationalize the number of children that they already have. Despite the generally pronatalist attitude ofwomen in Ondo State, there is some evidence of unwanted fertility in that 12 percent of women with 6 ormore children report lower ideal numbers of children.Table 5.6 indicates that there is variation in mean ideal numbers of children by age andbackground characteristics of women. The most outstanding difference is by area of residence; whileboth urban and rural women report an ideal family size of about six children, women in riverine areasfavor having well over 7 children on average. This pronatalist attitude of riverine women holds across allage groups.Table 5.6Mean Ideal Number of Children for All Women by Age and BackgroundCharacteristics, O<strong>DHS</strong>, 1986AgeBackgroundCharacter-Allistic 15-19 26-24 25-29 30-34 35-39 40-44 45~49 AgesResidenceUrbanRuralRiverineEducationNonePrimarySecondary +5.3 4.9 5.3 6.0 6.5 6.1 6.2 5.65.1 5.2 5.3 6.5 6.3 6.4 6.6 5.77.4 7.1 7.0 7.2 8.4 7.8 7.6 7.56.? 5.4 6.5 6.6 6.8 6.5 6,6 6.66,0 5.6 5.5 6.3 6,5 6.4 6.8 6.15.2 5.0 4.8 5.4 5.6 5.3 (5,7) 5.1ReligionCatholic 5.5 5.2 5.5 6.5 6.1 6.3 7.8 5.9Protestant 5.3 5.1 5.2 6.1 6.6 6.3 6.4 8.7Muslim 5.7 5.3 6.1 6.6 6.3 6.7 6,6 6.0Other/None (7.8) (8.0) (5.0) (7.3) (7.3) (7.0) (7.4) 7.2Total 5.4 5.2 5.3 6.3 6.5 6.3 6.6 5.7Note: Numbers in parentheses represent fewer than 20 c~ses.Women with secondary education prefer smaller families than less educated women, and womenwith primary education report higher ideal family sizes than women with no education in most agegroups. With regard to religion, Muslim women in almost every age group desire larger families thanCatholic or Protestant women.51


![Obtaining Informed Consent for HIV Testing [QRS4] - Measure DHS](https://img.yumpu.com/49850117/1/190x245/obtaining-informed-consent-for-hiv-testing-qrs4-measure-dhs.jpg?quality=85)


