

Final Report (PDF, 2132K) - Measure DHS
Final Report (PDF, 2132K) - Measure DHS
Final Report (PDF, 2132K) - Measure DHS

You also want an ePaper? Increase the reach of your titles
YUMPU automatically turns print PDFs into web optimized ePapers that Google loves.
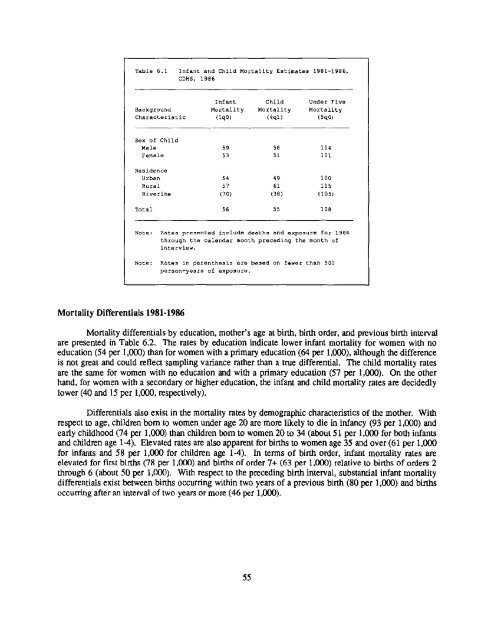
Table 6.1 Infant and Child Mortality Estimatss 1981-1986,O<strong>DHS</strong>, 1986Infant Child Under FiveBackground Mortality Mortality MortalityCharacteristic (lq0) (4ql) (Sq0)Sex of ChildMale 59 58 114Female 53 51 I01ResidenceUrban 54 49 100Rural 57 61 115Riverine (70) (38) (105)Total 56 55 108Note: Rates presented include deaths and exposure for 1986through ths calendar month preceding the month ofinterview.Note: Rates in parenthesis are based on fewer than 500person-years of exposure.Mortality Differentials 1981-1986Mortality differentials by education, mother's age at birth, birth order, and previous birth intervalare presented in Table 6.2. The rates by education indicate lower infant mortality for women with noeducation (54 per 1,000) than for women with a primary education (64 per 1,000), although the differenceis not great and could reflect sampling variance rather than a true differential. The child mortality ratesare the same for women with no education and with a primary education (57 per 1,000). On the otherhand, for women with a secondary or higher education, the infant and child mortality rates are decidedlylower (40 and 15 per 1,000, respectively).Differentials also exist in the mortality rates by demographic characteristics of the mother. Withrespect to age, children born to women under age 20 are more likely to die in infancy (93 per 1,000) andearly childhood (74 per 1,000) than children bom to women 20 to 34 (about 51 per 1,000 for both infantsand children age 1-4). Elevated rates are also apparent for births to women age 35 and over (61 per 1,000for infants and 58 per 1,000 for children age 1-4). In terms of birth order, infant mortality rates areelevated for first births (78 per 1,000) and births of order 7+ (63 per 1,000) relative to births of orders 2through 6 (about 50 per 1,000). With respect to the preceding birth interval, substantial infant mortalitydifferentials exist between births occurring within two years of a previous birth (80 per 1,0(30) and birthsoccurring after an interval of two years or more (46 per 1,000).55


![Obtaining Informed Consent for HIV Testing [QRS4] - Measure DHS](https://img.yumpu.com/49850117/1/190x245/obtaining-informed-consent-for-hiv-testing-qrs4-measure-dhs.jpg?quality=85)


