GEOLOGY<strong>Northland</strong>'s geology is a mixture of basement rock (greywacke), volcanic rock, sedimentary rocks, alluvial material,and sands. Uplifted blocks of hard blue-grey sandstone (greywacke) extend along the east coast from north of theBay of Islands as far south as the Brynderwyn range, and inland from Whangarei. To the west of these surfaceoutcrops, greywacke forms a basement deep beneath various sedimentary and volcanic rocks. Old volcanic rockoutcrops are a dramatic feature of the <strong>Northland</strong> landscape. Land slips are a frequent consequence of rain in<strong>Northland</strong> due to the steep topography and the soil structure.Rising sea levels have drowned river valleys to create several harbours which extend well into the interior of theregion. As a result, rivers tend to be short, dropping quickly in bouldery streams from higher country, and thenmeandering sluggishly through mangrove lined channels into harbours and estuaries.CLIMATE<strong>Northland</strong> has a sub-tropical climate that is characterised by mild, humid and often windy weather. The regionexperiences, on average, 2,000 hours of sunshine per year. Winds are mostly south-westerly but tropical cyclonesin the summer bring strong north-easterly winds and heavy rainfall. <strong>Northland</strong>’s rainfall distribution pattern isdictated by its narrow shape and its topography. Annual rainfalls range from 900 millimetres in low-lying coastalareas to over 2,900 millimetres in higher altitude areas such as Tutamoe Plateau. Seasonal influences on rainfallare well defined due to the seasonal movement of high pressure belts with up to one third of the annual totaloften falling in the three winter months. <strong>Northland</strong> also experiences high intensity rainfalls which can result inflash floods.HUMAN MODIFICATIONHuman modification of the natural environment can both worsen and mitigate natural processes that createhazards. Land change has generally led to an increase in hazards, particularly floods, landslides, and coastalhazards. Restoration of catchments, wetlands, dunes and other natural systems is now recognised as an integralpart of hazard management. In <strong>Northland</strong> this is promoted through the distribution of funds to <strong>Northland</strong>ers torevegetate land, protect wetlands and riparian margins, and promote restoration and management of duneenvironments. It is also controlled through land use planning.2.1.5 IMPLICATIONS FOR THE CDEM GROUP ENVIRONMENTThe implications of <strong>Northland</strong>’s regional profile for civil defence emergency management are identified below.These issues have been considered in developing the CDEM work plan and priorities.1. Numerous rural communities have the potential to become quickly isolated in an emergency because of theirremoteness, access (often gravel roads) and geography. Self-reliance and preparedness become even moreimportant for these communities.2. The vulnerability of some of the region’s infrastructure (power, roads) may impact on the ability of the regionto recover quickly from an emergency. Increased awareness of the region’s vulnerability to infrastructurefailure may help to encourage businesses to have their own backup systems and become more resilient tothese failures.3. The dependence on farming and horticultural industries means that the economy is vulnerable to hazards thatimpact those sectors (animal/plant diseases, drought, storms).4. The high percentage of Maori in the community may mean a need to communicate information about hazardsand preparedness measures differently.5. Communication strategies will need to consider internet access, which is below the national average. Forexample, not relying wholly on the NRC website to provide hazard information to communities.6. There are some communities/households without telecommunications, making them particularly vulnerablein an emergency.7. The high number of holiday homes can have an influence as holiday homes are less likely to have stocks toenable self-sufficiency for several days. Also, there is a belief that in a major Auckland disaster manythousands of people may self-evacuate to holiday homes in <strong>Northland</strong>.8. <strong>Northland</strong> has high levels of socio-economic deprivation, which means that many communities are moresusceptible to adverse effects of hazards and have less resources to support recovery.<strong>Northland</strong> <strong>Civil</strong> <strong>Defence</strong> <strong>Emergency</strong> <strong>Management</strong> <strong>Plan</strong>, <strong>2010</strong>-2015 Page 20
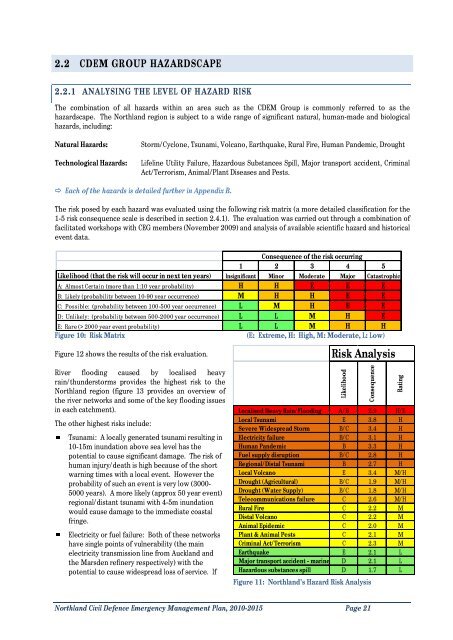
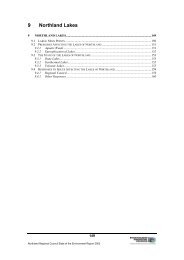
2.2 CDEM GROUP HAZARDSCAPE2.2.1 ANALYSING THE LEVEL OF HAZARD RISKThe combination of all hazards within an area such as the CDEM Group is commonly referred to as thehazardscape. The <strong>Northland</strong> region is subject to a wide range of significant natural, human-made and biologicalhazards, including:Natural Hazards:Technological Hazards:Storm/Cyclone, Tsunami, Volcano, Earthquake, Rural Fire, Human Pandemic, DroughtLifeline Utility Failure, Hazardous Substances Spill, Major transport accident, CriminalAct/Terrorism, Animal/<strong>Plan</strong>t Diseases and Pests. Each of the hazards is detailed further in Appendix B.The risk posed by each hazard was evaluated using the following risk matrix (a more detailed classification for the1-5 risk consequence scale is described in section 2.4.1). The evaluation was carried out through a combination offacilitated workshops with CEG members (November 2009) and analysis of available scientific hazard and historicalevent data.Consequence of the risk occurring1 2 3 4 5Likelihood (that the risk will occur in next ten years) Insignificant Minor Moderate Major CatastrophicA: Almost Certain (more than 1:10 year probability) H H E E EB: Likely (probability between 10-90 year occurrence) M H H E EC: Possible: (probability between 100-500 year occurrence) L M H E ED: Unlikely: (probability between 500-2000 year occurrence) L L M H EE: Rare (> 2000 year event probability) L L M H HFigure 10: Risk Matrix(E: Extreme, H: High, M: Moderate, L: Low)Figure 12 shows the results of the risk evaluation.Risk AnalysisRiver flooding caused by localised heavyrain/thunderstorms provides the highest risk to the<strong>Northland</strong> region (figure 13 provides an overview ofthe river networks and some of the key flooding issuesin each catchment).The other highest risks include:Tsunami: A locally generated tsunami resulting in10-15m inundation above sea level has thepotential to cause significant damage. The risk ofhuman injury/death is high because of the shortwarning times with a local event. However theprobability of such an event is very low (3000-5000 years). A more likely (approx 50 year event)regional/distant tsunami with 4-5m inundationwould cause damage to the immediate coastalfringe.Electricity or fuel failure: Both of these networkshave single points of vulnerability (the mainelectricity transmission line from Auckland andthe Marsden refinery respectively) with thepotential to cause widespread loss of service. IfLikelihoodFigure 11: <strong>Northland</strong>'s Hazard Risk AnalysisConsequenceRatingLocalised Heavy Rain/Flooding A/B 2.9 H/ELocal Tsunami E 3.8 HSevere Widespread Storm B/C 3.4 HElectricity failure B/C 3.1 HHuman Pandemic B 3.3 HFuel supply disruption B/C 2.8 HRegional/Distal Tsunami B 2.7 HLocal Volcano E 3.4 M/HDrought (Agricultural) B/C 1.9 M/HDrought (Water Supply) B/C 1.8 M/HTelecommunications failure C 2.6 M/HRural Fire C 2.2 MDistal Volcano C 2.2 MAnimal Epidemic C 2.0 M<strong>Plan</strong>t & Animal Pests C 2.1 MCriminal Act/Terrorism C 2.3 MEarthquake E 2.1 LMajor transport accident - marine D 2.1 LHazardous substances spill D 1.7 L<strong>Northland</strong> <strong>Civil</strong> <strong>Defence</strong> <strong>Emergency</strong> <strong>Management</strong> <strong>Plan</strong>, <strong>2010</strong>-2015 Page 21