Mixture Design Tutorial (Part 1 â The Basics) - Statease.info
Mixture Design Tutorial (Part 1 â The Basics) - Statease.info
Mixture Design Tutorial (Part 1 â The Basics) - Statease.info

You also want an ePaper? Increase the reach of your titles
YUMPU automatically turns print PDFs into web optimized ePapers that Google loves.
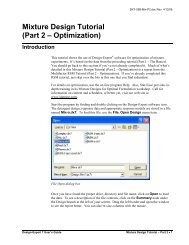
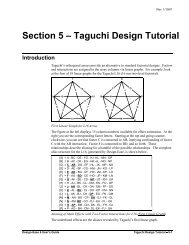
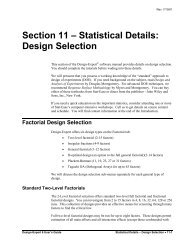
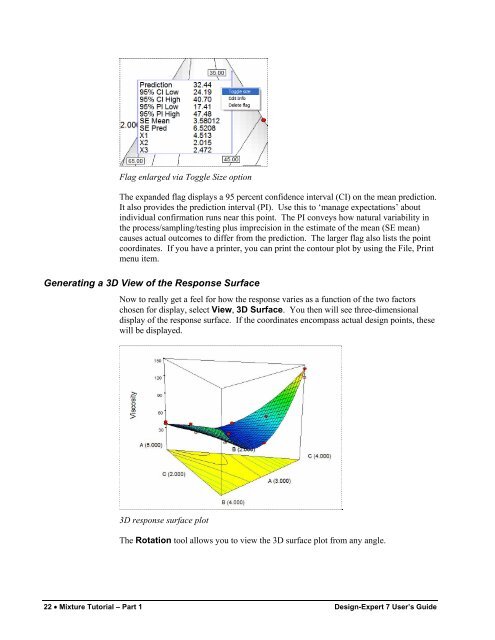
Flag enlarged via Toggle Size option<strong>The</strong> expanded flag displays a 95 percent confidence interval (CI) on the mean prediction.It also provides the prediction interval (PI). Use this to ‘manage expectations’ aboutindividual confirmation runs near this point. <strong>The</strong> PI conveys how natural variability inthe process/sampling/testing plus imprecision in the estimate of the mean (SE mean)causes actual outcomes to differ from the prediction. <strong>The</strong> larger flag also lists the pointcoordinates. If you have a printer, you can print the contour plot by using the File, Printmenu item.Generating a 3D View of the Response SurfaceNow to really get a feel for how the response varies as a function of the two factorschosen for display, select View, 3D Surface. You then will see three-dimensionaldisplay of the response surface. If the coordinates encompass actual design points, thesewill be displayed.3D response surface plot<strong>The</strong> Rotation tool allows you to view the 3D surface plot from any angle.22 • <strong>Mixture</strong> <strong>Tutorial</strong> – <strong>Part</strong> 1 <strong>Design</strong>-Expert 7 User’s Guide