Mixture Design Tutorial (Part 1 â The Basics) - Statease.info
Mixture Design Tutorial (Part 1 â The Basics) - Statease.info
Mixture Design Tutorial (Part 1 â The Basics) - Statease.info

Create successful ePaper yourself
Turn your PDF publications into a flip-book with our unique Google optimized e-Paper software.
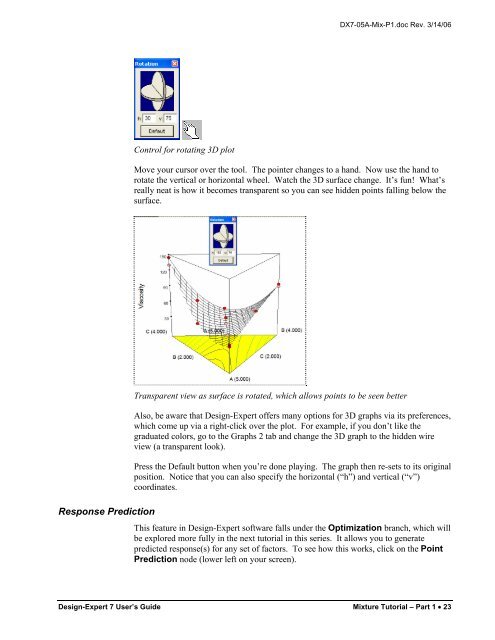
DX7-05A-Mix-P1.doc Rev. 3/14/06Control for rotating 3D plotMove your cursor over the tool. <strong>The</strong> pointer changes to a hand. Now use the hand torotate the vertical or horizontal wheel. Watch the 3D surface change. It’s fun! What’sreally neat is how it becomes transparent so you can see hidden points falling below thesurface.Response PredictionTransparent view as surface is rotated, which allows points to be seen betterAlso, be aware that <strong>Design</strong>-Expert offers many options for 3D graphs via its preferences,which come up via a right-click over the plot. For example, if you don’t like thegraduated colors, go to the Graphs 2 tab and change the 3D graph to the hidden wireview (a transparent look).Press the Default button when you’re done playing. <strong>The</strong> graph then re-sets to its originalposition. Notice that you can also specify the horizontal (“h”) and vertical (“v”)coordinates.This feature in <strong>Design</strong>-Expert software falls under the Optimization branch, which willbe explored more fully in the next tutorial in this series. It allows you to generatepredicted response(s) for any set of factors. To see how this works, click on the PointPrediction node (lower left on your screen).<strong>Design</strong>-Expert 7 User’s Guide <strong>Mixture</strong> <strong>Tutorial</strong> – <strong>Part</strong> 1 • 23