

and Master Programmes in German Higher Education Institutions
and Master Programmes in German Higher Education Institutions
and Master Programmes in German Higher Education Institutions
- No tags were found...

You also want an ePaper? Increase the reach of your titles
YUMPU automatically turns print PDFs into web optimized ePapers that Google loves.
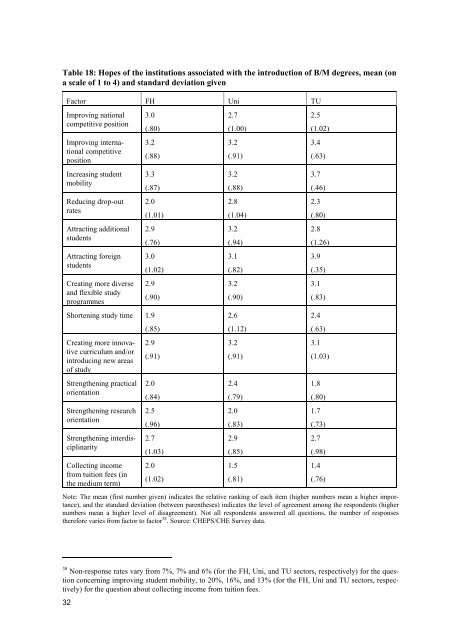
Table 18: Hopes of the <strong>in</strong>stitutions associated with the <strong>in</strong>troduction of B/M degrees, mean (ona scale of 1 to 4) <strong>and</strong> st<strong>and</strong>ard deviation givenFactor FH Uni TUImprov<strong>in</strong>g nationalcompetitive positionImprov<strong>in</strong>g <strong>in</strong>ternationalcompetitivepositionIncreas<strong>in</strong>g studentmobilityReduc<strong>in</strong>g drop-outratesAttract<strong>in</strong>g additionalstudentsAttract<strong>in</strong>g foreignstudentsCreat<strong>in</strong>g more diverse<strong>and</strong> flexible studyprogrammes3.0(.80)3.2(.88)3.3(.87)2.0(1.01)2.9(.76)3.0(1.02)2.9(.90)Shorten<strong>in</strong>g study time 1.9(.85)Creat<strong>in</strong>g more <strong>in</strong>novativecurriculum <strong>and</strong>/or<strong>in</strong>troduc<strong>in</strong>g new areasof studyStrengthen<strong>in</strong>g practicalorientationStrengthen<strong>in</strong>g researchorientationStrengthen<strong>in</strong>g <strong>in</strong>terdiscipl<strong>in</strong>arityCollect<strong>in</strong>g <strong>in</strong>comefrom tuition fees (<strong>in</strong>the medium term)2.9(.91)2.0(.84)2.5(.96)2.7(1.03)2.0(1.02)2.7(1.00)3.2(.91)3.2(.88)2.8(1.04)3.2(.94)3.1(.82)3.2(.90)2.6(1.12)3.2(.91)2.4(.79)2.0(.83)2.9(.85)1.5(.81)2.5(1.02)3.4(.63)3.7(.46)2.3(.80)2.8(1.26)3.9(.35)3.1(.83)2.4(.63)3.1(1.03)1.8(.80)1.7(.73)2.7(.98)1.4(.76)Note: The mean (first number given) <strong>in</strong>dicates the relative rank<strong>in</strong>g of each item (higher numbers mean a higher importance),<strong>and</strong> the st<strong>and</strong>ard deviation (between parentheses) <strong>in</strong>dicates the level of agreement among the respondents (highernumbers mean a higher level of disagreement). Not all respondents answered all questions, the number of responsestherefore varies from factor to factor 38 . Source: CHEPS/CHE Survey data.38 Non-response rates vary from 7%, 7% <strong>and</strong> 6% (for the FH, Uni, <strong>and</strong> TU sectors, respectively) for the questionconcern<strong>in</strong>g improv<strong>in</strong>g student mobility, to 20%, 16%, <strong>and</strong> 13% (for the FH, Uni <strong>and</strong> TU sectors, respectively)for the question about collect<strong>in</strong>g <strong>in</strong>come from tuition fees.32


