OAO GAZPROMNOTES TO THE IAS CONSOLIDATED FINANCIAL STATEMENTS—(Continued)(In millions of Russian Roubles in terms of the equivalent purchasing power of the Rouble at31 December 2001, except as noted)8 ACCOUNTS RECEIVABLE AND PREPAYMENTS31 December2000 1999Trade receivables (net of a provision for doubtful accounts of RR 83,021 andRR 72,460 at 31 December 2000 and 1999, respectively) 205,132 220,702Prepayments and advances paid (net of a provision for doubtful accounts ofRR 6,421 and RR 8,246 at 31 December 2000 and 1999, respectively) 33,260 23,875Other receivables (net of a provision for doubtful accounts of RR 30,473 andRR 28,022 at 31 December 2000 and 1999, respectively) 76,836 69,212315,228 313,789Substantially all trade receivables are currently receivable in accordance with their contractualterms and, accordingly, are classified as current assets. Management has considered the likelihood ofcollection of receivables beyond 2001 when determining the amount of the provision for doubtfulaccounts.RR 94,446 and RR 108,072 of trade receivables are denominated in hard currency, mainly UnitedStates ("US") dollars, at 31 December 2000 and 1999, respectively.Other receivables include RR 26,614 and RR 34,262 of receivables relating to the operations of<strong>Gazprom</strong>bank and National Reserve Bank (see Note 23) at 31 December 2000 and 1999, respectively.These balances mainly represent loans issued to other banks and customers at commercial ratesranging from 4.7% to 23.6% per annum at 31 December 2000 and 3% to 40% per annum at 31December 1999.9 INVENTORIES31 December2000 1999NoteMaterials and supplies 34,972 29,39820 Gas (in pipelines and storage) 29,699 25,142Goods for resale 4,014 4,251Other 1,650 2,66570,335 61,456Inventories are presented net of a provision for obsolescence of RR 14,339 and RR 9,790 at 31December 2000 and 1999, respectively.Goods for resale are stated at their net realisable value at 31 December 2000 and 1999,respectively.F-18
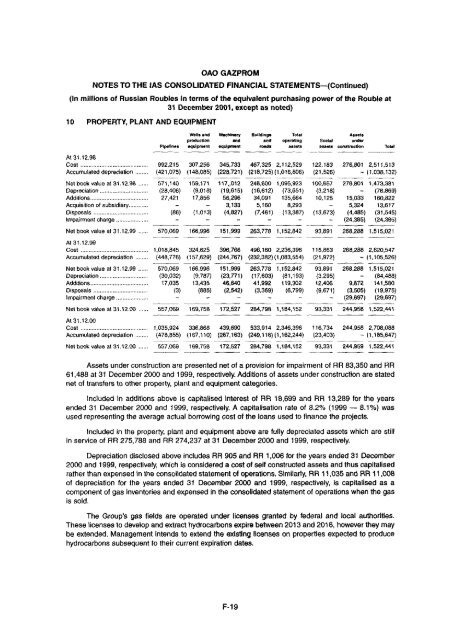
OAO GAZPROMNOTES TO THE IAS CONSOLIDATED FINANCIAL STATEMENTS—(Continued)(In millions of Russian Roubles in terms of the equivalent purchasing power of the Rouble at31 December 2001, except as noted)10 PROPERTY, PLANT AND EQUIPMENTWells and Machinery Buildings Total Assetsproduction and and operating Social underPipelines equipment equipment roads assets assets construction TotalAt 31.12.98Cost 992,215 307,256 345,733 467,325 2,112,529 122,183 276,801 2,511,513Accumulated depreciation (421,075) (148,085) (228,721) (218,725) (1,016,606) (21,526) – (1,038,132)Net book value at 31.12.98 571,140 159,171 117„012 248,600 1,095,923 100,657 276,801 1,473,381Depreciation (28,406) (9,018) (19,615) (16,612) (73,651) (3,218) – (76,869)Additions 27,421 17,856 56,296 34,091 135,664 10,125 15,033 160,822Acquisition of subsidiary – – 3,133 5,160 8,293 – 5,324 13,617Disposals (86) (1,013) (4,827) (7,461) (13,387) (13,673) (4,485) (31,545)Impairment charge – – – – – – (24,385) (24,385)Net book value at 31.12.99 570,069 166,996 151,999 263,778 1,152,842 93,891 268,288 1,515,021At 31.12.99Cost 1,018,845 324,625 396,766 496,160 2,236,396 115,863 268,288 2,620,547Accumulated depreciation (448,776) (157,629) (244,767) (232,382) (1,083,554) (21,972) – (1,105,526)Net book value at 31.12.99 570,069 166,996 151,999 263,778 1,152,842 93,891 268,288 1,515,021Depreciation (30,032) (9,787) (23,771) (17,603) (81,193) (3,295) – (84,488)Additions 17,035 13,435 46,840 41,992 119,302 12,406 9,872 141,580Disposals (3) (885) (2,542) (3,369) (6,799) (9,671) (3,505) (19,975)Impairment charge – – – – – – (29,697) (29,697)Net book value at 31.12.00 557,069 169,758 172,527 284,798 1,184,152 93,331 244,958 1,522,441At 31.12.00Cost 1,035,924 336,868 439,690 533,914 2,346,396 116,734 244,958 2,708,088Accumulated depreciation (478,855) (167,110) (267,163) (249,116) (1,162,244) (23,403) – (1,185,647)Net book value at 31.12.00 557,069 169,758 172,527 284,798 1,184,152 93,331 244,959 1,522,441Assets under construction are presented net of a provision for impairment of RR 83,350 and RR61,488 at 31 December 2000 and 1999, respectively. Additions of assets under construction are statednet of transfers to other property, plant and equipment categories.Included in additions above is capitalised interest of RR 18,699 and RR 13,289 for the yearsended 31 December 2000 and 1999, respectively. A capitalisation rate of 8.2% (1999 — 8.1%) wasused representing the average actual borrowing cost of the loans used to finance the projects.Included in the property, plant and equipment above are fully depreciated assets which are stillin service of RR 275,788 and RR 274,237 at 31 December 2000 and 1999, respectively.Depreciation disclosed above includes RR 905 and RR 1,006 for the years ended 31 December2000 and 1999, respectively, which is considered a cost of self constructed assets and thus capitalisedrather than expensed in the consolidated statement of operations. Similarly, RR 11,035 and RR 11,008of depreciation for the years ended 31 December 2000 and 1999, respectively, is capitalised as acomponent of gas inventories and expensed in the consolidated statement of operations when the gasis sold.The Group's gas fields are operated under licenses granted by federal and local authorities.These licenses to develop and extract hydrocarbons expire between 2013 and 2016, however they maybe extended. Management intends to extend the existing licenses on properties expected to producehydrocarbons subsequent to their current expiration dates.F-19
- Page 1:
OFFERING CIRCULARJOINT-STOCKCOMPANY
- Page 4 and 5:
classifications and methodologies,
- Page 6 and 7:
INVESTMENT CONSIDERATIONSAn investm
- Page 8 and 9:
Relationship with the GovernmentThe
- Page 10 and 11:
elation to its assets and operation
- Page 12 and 13:
Ethnic and religious differences in
- Page 14 and 15:
TRANSACTION SUMMARYThe transaction
- Page 16 and 17:
SELECTED FINANCIAL INFORMATIONThe s
- Page 18 and 19:
CAPITALISATIONThe following table s
- Page 20 and 21:
OAO GAZPROMPrivatisation and Format
- Page 22 and 23:
Gazprom Shares. The Presidential De
- Page 24 and 25:
Gazprom's main subsidiaries were, a
- Page 26 and 27:
Management StructureIn accordance w
- Page 28 and 29:
The current membership of Gazprom's
- Page 30 and 31:
1999 2000 2001(mtoe, except for per
- Page 32 and 33:
Central and Eastern EuropeGazprom e
- Page 34 and 35:
U.S.$43 million and from those cust
- Page 36 and 37:
Country% OFEUROPEANNATURALGAS SUPPL
- Page 38 and 39:
As at 31 December 2000, proved and
- Page 40 and 41:
The following table sets out, as at
- Page 42 and 43:
een put on stream at the Astrakhans
- Page 44 and 45:
Orenburg Helium Plant. This is Russ
- Page 46 and 47:
The following table sets forth some
- Page 48 and 49:
Gazprom provides the independent su
- Page 50 and 51:
INTERNATIONAL PROJECTS AND ALLIANCE
- Page 52 and 53:
major natural gas distributor in ea
- Page 54 and 55:
Other foreign associate undertaking
- Page 56 and 57:
Gazprom has developed and continues
- Page 58 and 59:
LOAN AGREEMENTThe following is the
- Page 60 and 61:
"Notes" means the U.S.$500,000,000
- Page 62 and 63:
"Subsidiary" means, with respect to
- Page 64 and 65:
5 Repayment and Prepayment5.1 Repay
- Page 66 and 67:
the amount of any such payment and
- Page 68 and 69:
necessary to compensate the Bank fo
- Page 70 and 71:
9.1.15 In any proceedings taken in
- Page 72 and 73:
10.6 Payment of Taxes and Other Cla
- Page 74 and 75:
ankruptcy law, or (iii) a bankruptc
- Page 76 and 77:
execution of this Agreement and all
- Page 78 and 79:
14.8 Contracts (Rights of Third Par
- Page 80 and 81:
TERMS AND CONDITIONS OF THE NOTESTh
- Page 82 and 83:
Under the Trust Deed, the obligatio
- Page 84 and 85: Payments of interest shall be made
- Page 86 and 87: The Trustee may agree, without the
- Page 88 and 89: SUMMARY OF PROVISIONS RELATING TO T
- Page 90 and 91: circumstances, if the disposal proc
- Page 92 and 93: SALOMON BROTHERS AGThe Bank is lice
- Page 94 and 95: GENERAL INFORMATION1. The Notes rep
- Page 96 and 97: force is being formed to gradually
- Page 98 and 99: to address these pressures. First,
- Page 100 and 101: Balance of PaymentsThe following ta
- Page 102 and 103: understanding that it would serve a
- Page 104 and 105: GeneralAPPENDIX B - PART 1 - OVERVI
- Page 106 and 107: most important recent piece of legi
- Page 108 and 109: integrated objects managed on a cen
- Page 110 and 111: • price regulation - setting pric
- Page 112 and 113: APPENDIX B — PART II — EXTRACT
- Page 114 and 115: APPENDIX C - GLOSSARY OF TERMS"Acco
- Page 116 and 117: "State Gas Concern Gazprom"the Stat
- Page 118 and 119: OAO GAZPROMIAS CONSOLIDATED FINANCI
- Page 120 and 121: OAO GAZPROMIAS CONSOLIDATED BALANCE
- Page 122 and 123: OAO GAZPROMIAS CONSOLIDATED STATEME
- Page 124 and 125: OAO GAZPROMNOTES TO THE IAS CONSOLI
- Page 126 and 127: OAO GAZPROMNOTES TO THE IAS CONSOLI
- Page 128 and 129: OAO GAZPROMNOTES TO THE IAS CONSOLI
- Page 130 and 131: OAO GAZPROMNOTES TO THE IAS CONSOLI
- Page 132 and 133: OAO GAZPROMNOTES TO THE IAS CONSOLI
- Page 136 and 137: OAO GAZPROMNOTES TO THE IAS CONSOLI
- Page 138 and 139: OAO GAZPROMNOTES TO THE IAS CONSOLI
- Page 140 and 141: OAO GAZPROMNOTES TO THE IAS CONSOLI
- Page 142 and 143: OAO GAZPROMNOTES TO THE IAS CONSOLI
- Page 144 and 145: OAO GAZPROMNOTES TO THE IAS CONSOLI
- Page 146 and 147: OAO GAZPROMNOTES TO THE IAS CONSOLI
- Page 148 and 149: OAO GAZPROMNOTES TO THE IAS CONSOLI
- Page 150 and 151: OAO GAZPROMNOTES TO THE IAS CONSOLI
- Page 152 and 153: OAO GAZPROMNOTES TO THE IAS CONSOLI
- Page 154 and 155: OAO GAZPROMNOTES TO THE IAS CONSOLI
- Page 156 and 157: OAO GAZPROMNOTES TO THE IAS CONSOLI
- Page 158 and 159: PRlCEWATERHOUSECOOPERSZAO Pricewate
- Page 160 and 161: OAO GAZPROMIAS CONSOLIDATED STATEME
- Page 162 and 163: OAO GAZPROMIAS CONSOLIDATED STATEME
- Page 164 and 165: OAO GAZPROMNOTES TO THE IAS CONSOLI
- Page 166 and 167: OAO GAZPROMNOTES TO THE IAS CONSOLI
- Page 168 and 169: OAO GAZPROMNOTES TO THE IAS CONSOLI
- Page 170 and 171: OAO GAZPROMNOTES TO THE IAS CONSOLI
- Page 172 and 173: OAO GAZPROMNOTES TO THE IAS CONSOLI
- Page 174 and 175: OAO GAZPROMNOTES TO THE IAS CONSOLI
- Page 176 and 177: OAO GAZPROMNOTES TO THE IAS CONSOLI
- Page 178 and 179: OAO GAZPROMNOTES TO THE IAS CONSOLI
- Page 180 and 181: OAO GAZPROMNOTES TO THE IAS CONSOLI
- Page 182 and 183: OAO GAZPROMNOTES TO THE IAS CONSOLI
- Page 184 and 185:
OAO GAZPROMNOTES TO THE IAS CONSOLI
- Page 186 and 187:
OAO GAZPROMNOTES TO THE IAS CONSOLI
- Page 188 and 189:
OAO GAZPROMNOTES TO THE IAS CONSOLI
- Page 190 and 191:
OAO GAZPROMNOTES TO THE IAS CONSOLI
- Page 192 and 193:
OAO GAZPROMNOTES TO THE IAS CONSOLI
- Page 194 and 195:
OAO GAZPROMNOTES TO THE IAS CONSOLI
- Page 196 and 197:
OAO GAZPROMNOTES TO THE IAS CONSOLI
- Page 198 and 199:
OAO GAZPROMNOTES TO THE IAS CONSOLI
- Page 200 and 201:
OAO GAZPROMNOTES TO THE IAS CONSOLI
- Page 202 and 203:
OAO GAZPROMINVESTOR RELATIONSThe Co
- Page 204 and 205:
LEGAL ADVISERSTo the CompanyAs to R
- Page 206:
printed by eprintfinancial.comtel: