BuSiNeSS PlAN - California Lottery
BuSiNeSS PlAN - California Lottery
BuSiNeSS PlAN - California Lottery

Create successful ePaper yourself
Turn your PDF publications into a flip-book with our unique Google optimized e-Paper software.
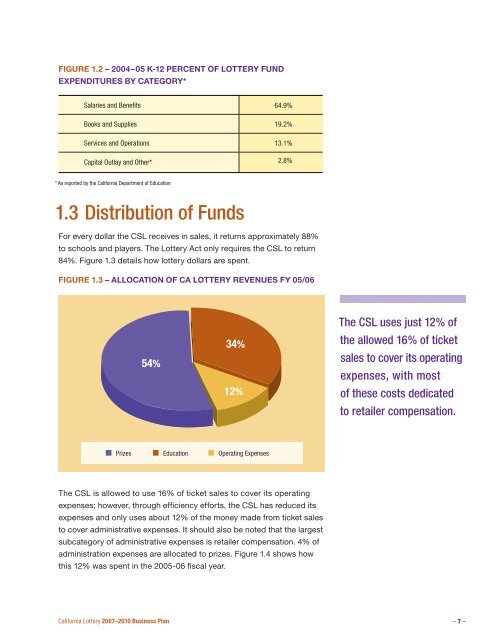
Figure 1.2 – 2004–05 K-12 Percent of <strong>Lottery</strong> FundExpenditures by Category*Salaries and Benefits 64.9%Books and Supplies 19.2%Services and Operations 13.1%Capital Outlay and Other* 2.8%* As reported by the <strong>California</strong> Department of Education1.3 Distribution of FundsFor every dollar the CSL receives in sales, it returns approximately 88%to schools and players. The <strong>Lottery</strong> Act only requires the CSL to return84%. Figure 1.3 details how lottery dollars are spent.Figure 1.3 – Allocation of CA <strong>Lottery</strong> Revenues FY 05/0654%34%12%The CSL uses just 12% ofthe allowed 16% of ticketsales to cover its operatingexpenses, with mostof these costs dedicatedto retailer compensation.Prizes Education Operating ExpensesThe CSL is allowed to use 16% of ticket sales to cover its operatingexpenses; however, through efficiency efforts, the CSL has reduced itsexpenses and only uses about 12% of the money made from ticket salesto cover administrative expenses. It should also be noted that the largestsubcategory of administrative expenses is retailer compensation. 4% ofadministration expenses are allocated to prizes. Figure 1.4 shows howthis 12% was spent in the 2005-06 fiscal year.<strong>California</strong> <strong>Lottery</strong> 2007–2010 Business Plan – –