BuSiNeSS PlAN - California Lottery
BuSiNeSS PlAN - California Lottery
BuSiNeSS PlAN - California Lottery

Create successful ePaper yourself
Turn your PDF publications into a flip-book with our unique Google optimized e-Paper software.
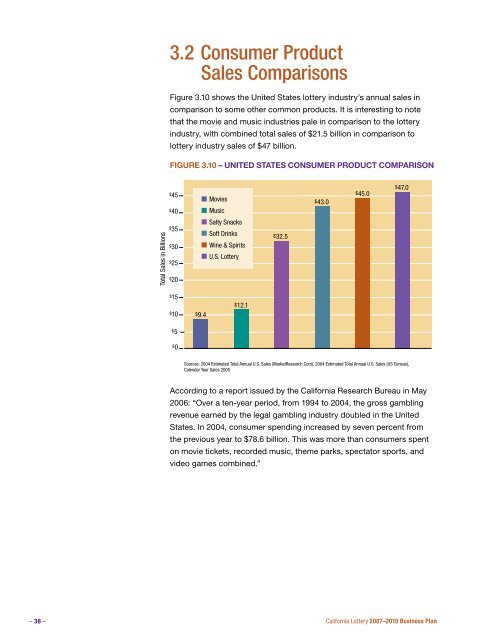
3.2 Consumer ProductSales ComparisonsFigure 3.10 shows the United States lottery industry’s annual sales incomparison to some other common products. It is interesting to notethat the movie and music industries pale in comparison to the lotteryindustry, with combined total sales of $21.5 billion in comparison tolottery industry sales of $47 billion.Figure 3.10 – United Fig. 4.10 States US Consumer Consumer Product Comparison Product Comparison$45$40MoviesMusic$43.0$45.0$47.0Total Sales in Billions$35$30$25$20Salty SnacksSoft DrinksWine & SpiritsU.S. <strong>Lottery</strong>$32.5$15$10$9.4$12.1$5$0Sources: 2004 Estimated Total Annual U.S. Sales (MarketResearch.Com), 2004 Estimated Total Annual U.S. Sales (US Census),Calendar Year Sales 2005According to a report issued by the <strong>California</strong> Research Bureau in May2006: “Over a ten-year period, from 1994 to 2004, the gross gamblingrevenue earned by the legal gambling industry doubled in the UnitedStates. In 2004, consumer spending increased by seven percent fromthe previous year to $78.6 billion. This was more than consumers spenton movie tickets, recorded music, theme parks, spectator sports, andvideo games combined.”– 36 –<strong>California</strong> <strong>Lottery</strong> 2007–2010 Business Plan