BuSiNeSS PlAN - California Lottery
BuSiNeSS PlAN - California Lottery
BuSiNeSS PlAN - California Lottery

Create successful ePaper yourself
Turn your PDF publications into a flip-book with our unique Google optimized e-Paper software.
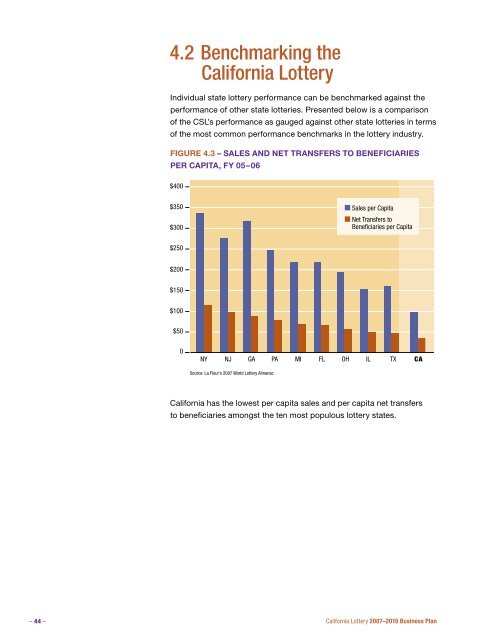
4.2 Benchmarking the<strong>California</strong> <strong>Lottery</strong>Individual state lottery performance can be benchmarked against theperformance of other state lotteries. Presented below is a comparisonof the CSL’s performance as gauged against other state lotteries in termsof the most common performance benchmarks in the lottery industry.Figure 4.3 – Sales and Net Transfers to BeneficiariesPer Capita, 4.3 Sales FY and 05–06 Net Transfers to Beneficiaries per Capita, FY 05–06$400$350$300Sales per CapitaNet Transfers toBeneficiaries per Capita$250$200$150$100$500NY NJ GA PA MI FL OH IL TX CASource: La Fleur’s 2007 World <strong>Lottery</strong> Almanac<strong>California</strong> has the lowest per capita sales and per capita net transfersto beneficiaries amongst the ten most populous lottery states.– 44 –<strong>California</strong> <strong>Lottery</strong> 2007–2010 Business Plan