BuSiNeSS PlAN - California Lottery
BuSiNeSS PlAN - California Lottery
BuSiNeSS PlAN - California Lottery

Create successful ePaper yourself
Turn your PDF publications into a flip-book with our unique Google optimized e-Paper software.
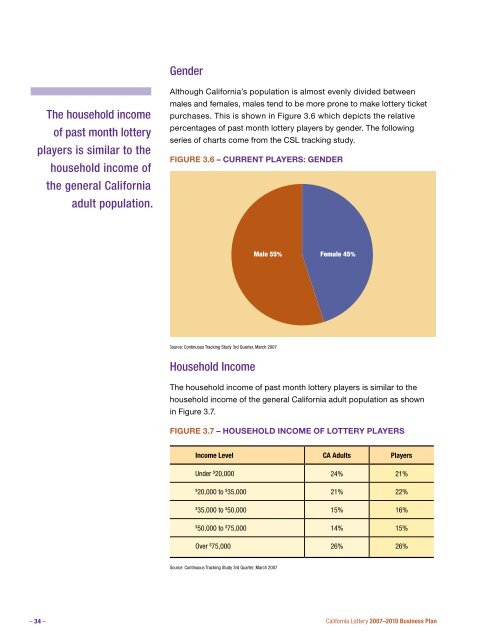
GenderThe household incomeof past month lotteryplayers is similar to thehousehold income ofthe general <strong>California</strong>adult population.Although <strong>California</strong>’s population is almost evenly divided betweenmales and females, males tend to be more prone to make lottery ticketpurchases. This is shown in Figure 3.6 which depicts the relativepercentages of past month lottery players by gender. The followingseries of charts come from the CSL tracking study.Figure 3.6 – CurrentFig. 3.6Players:Current Players:GenderGenderMale 55%Female 45%Source: Continuous Tracking Study 3rd Quarter, March 2007Household IncomeThe household income of past month lottery players is similar to thehousehold income of the general <strong>California</strong> adult population as shownin Figure 3.7.Figure 3.7 – Household Income of <strong>Lottery</strong> PlayersIncome Level CA Adults PlayersUnder $ 20,000 24% 21%$20,000 to $ 35,000 21% 22%$35,000 to $ 50,000 15% 16%$50,000 to $ 75,000 14% 15%Over $ 75,000 26% 26%Source: Continuous Tracking Study 3rd Quarter, March 2007– 34 –<strong>California</strong> <strong>Lottery</strong> 2007–2010 Business Plan