BuSiNeSS PlAN - California Lottery
BuSiNeSS PlAN - California Lottery
BuSiNeSS PlAN - California Lottery

Create successful ePaper yourself
Turn your PDF publications into a flip-book with our unique Google optimized e-Paper software.
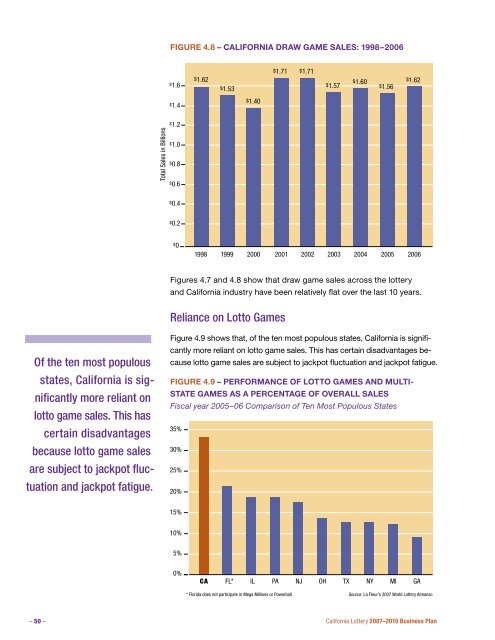
Figure 4.8 – <strong>California</strong> Fig. 5.8 <strong>California</strong> Draw Game Sales: 1998-2006 1998–2006$1.6$1.62$1.53$1.71 $1.71$1.57$1.60$1.56$1.62$1.4$1.40$1.2Total Sales in Billions$1.0$0.8$0.6$0.4$0.2$01998 1999 2000 2001 2002 2003 2004 2005 2006Figures 4.7 and 4.8 show that draw game sales across the lotteryand <strong>California</strong> industry have been relatively flat over the last 10 years.Reliance on Lotto GamesOf the ten most populousstates, <strong>California</strong> is significantlymore reliant onlotto game sales. This hascertain disadvantagesbecause lotto game salesare subject to jackpot fluctuationand jackpot fatigue.Figure 4.9 shows that, of the ten most populous states, <strong>California</strong> is significantlymore reliant on lotto game sales. This has certain disadvantages becauselotto game sales are subject to jackpot fluctuation and jackpot fatigue.FigureFig.4.95.9 Performance– Performanceof Lotto Gamesof Lottoand Multi-StateGames andGamesMulti-State as Games a Percentage as a of Percentage Overall Sales of Overall SalesFiscal Fiscal year Year 2005–06 Comparison of of Ten Ten Most Most Populous Populous States States35%30%25%20%15%10%5%0%CA FL* IL PA NJ OH TX NY MI GA* Florida does not participate in Mega Millions or PowerballSource: La Fleur’s 2007 World <strong>Lottery</strong> Almanac– 50 –<strong>California</strong> <strong>Lottery</strong> 2007–2010 Business Plan