Annual Report for 2010/11 and Forward Programme - Sellafield Ltd
Annual Report for 2010/11 and Forward Programme - Sellafield Ltd
Annual Report for 2010/11 and Forward Programme - Sellafield Ltd
Create successful ePaper yourself
Turn your PDF publications into a flip-book with our unique Google optimized e-Paper software.
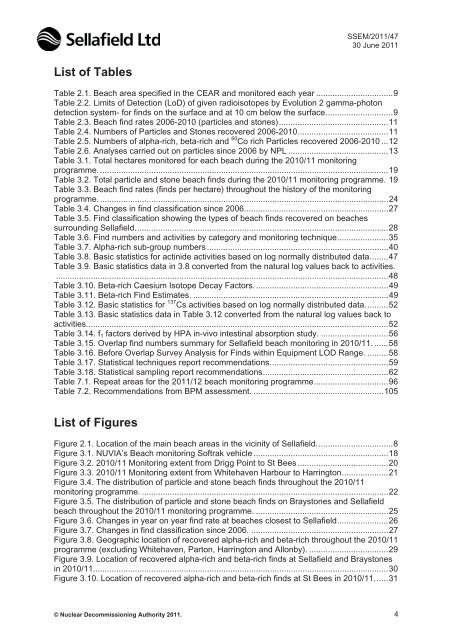
SSEM/20<strong>11</strong>/4730 June 20<strong>11</strong>List of TablesTable 2.1. Beach area specified in the CEAR <strong>and</strong> monitored each year .................................9Table 2.2. Limits of Detection (LoD) of given radioisotopes by Evolution 2 gamma-photondetection system- <strong>for</strong> finds on the surface <strong>and</strong> at 10 cm below the surface.............................9Table 2.3. Beach find rates 2006-<strong>2010</strong> (particles <strong>and</strong> stones)...............................................<strong>11</strong>Table 2.4. Numbers of Particles <strong>and</strong> Stones recovered 2006-<strong>2010</strong>.......................................<strong>11</strong>Table 2.5. Numbers of alpha-rich, beta-rich <strong>and</strong> 60 Co rich Particles recovered 2006-<strong>2010</strong> ...12Table 2.6. Analyses carried out on particles since 2006 by NPL ...........................................13Table 3.1. Total hectares monitored <strong>for</strong> each beach during the <strong>2010</strong>/<strong>11</strong> monitoringprogramme. ............................................................................................................................19Table 3.2. Total particle <strong>and</strong> stone beach finds during the <strong>2010</strong>/<strong>11</strong> monitoring programme. 19Table 3.3. Beach find rates (finds per hectare) throughout the history of the monitoringprogramme. ............................................................................................................................24Table 3.4. Changes in find classification since 2006..............................................................27Table 3.5. Find classification showing the types of beach finds recovered on beachessurrounding <strong>Sellafield</strong>.............................................................................................................28Table 3.6. Find numbers <strong>and</strong> activities by category <strong>and</strong> monitoring technique......................35Table 3.7. Alpha-rich sub-group numbers ..............................................................................40Table 3.8. Basic statistics <strong>for</strong> actinide activities based on log normally distributed data........47Table 3.9. Basic statistics data in 3.8 converted from the natural log values back to activities................................................................................................................................................48Table 3.10. Beta-rich Caesium Isotope Decay Factors..........................................................49Table 3.<strong>11</strong>. Beta-rich Find Estimates. ....................................................................................49Table 3.12. Basic statistics <strong>for</strong> 137 Cs activities based on log normally distributed data..........52Table 3.13. Basic statistics data in Table 3.12 converted from the natural log values back toactivities..................................................................................................................................52Table 3.14. f 1 factors derived by HPA in-vivo intestinal absorption study. .............................56Table 3.15. Overlap find numbers summary <strong>for</strong> <strong>Sellafield</strong> beach monitoring in <strong>2010</strong>/<strong>11</strong>. ......58Table 3.16. Be<strong>for</strong>e Overlap Survey Analysis <strong>for</strong> Finds within Equipment LOD Range. .........58Table 3.17. Statistical techniques report recommendations...................................................59Table 3.18. Statistical sampling report recommendations......................................................62Table 7.1. Repeat areas <strong>for</strong> the 20<strong>11</strong>/12 beach monitoring programme................................96Table 7.2. Recommendations from BPM assessment. ........................................................105List of FiguresFigure 2.1. Location of the main beach areas in the vicinity of <strong>Sellafield</strong>.................................8Figure 3.1. NUVIA’s Beach monitoring Softrak vehicle ..........................................................18Figure 3.2. <strong>2010</strong>/<strong>11</strong> Monitoring extent from Drigg Point to St Bees .......................................20Figure 3.3. <strong>2010</strong>/<strong>11</strong> Monitoring extent from Whitehaven Harbour to Harrington....................21Figure 3.4. The distribution of particle <strong>and</strong> stone beach finds throughout the <strong>2010</strong>/<strong>11</strong>monitoring programme. ..........................................................................................................22Figure 3.5. The distribution of particle <strong>and</strong> stone beach finds on Braystones <strong>and</strong> <strong>Sellafield</strong>beach throughout the <strong>2010</strong>/<strong>11</strong> monitoring programme. .........................................................25Figure 3.6. Changes in year on year find rate at beaches closest to <strong>Sellafield</strong>......................26Figure 3.7. Changes in find classification since 2006. ...........................................................27Figure 3.8. Geographic location of recovered alpha-rich <strong>and</strong> beta-rich throughout the <strong>2010</strong>/<strong>11</strong>programme (excluding Whitehaven, Parton, Harrington <strong>and</strong> Allonby). ..................................29Figure 3.9. Location of recovered alpha-rich <strong>and</strong> beta-rich finds at <strong>Sellafield</strong> <strong>and</strong> Braystonesin <strong>2010</strong>/<strong>11</strong>...............................................................................................................................30Figure 3.10. Location of recovered alpha-rich <strong>and</strong> beta-rich finds at St Bees in <strong>2010</strong>/<strong>11</strong>......31© Nuclear Decommissioning Authority 20<strong>11</strong>. 4


