Uptown Transportation Study CHAPTER 7: PARKING - OKI
Uptown Transportation Study CHAPTER 7: PARKING - OKI
Uptown Transportation Study CHAPTER 7: PARKING - OKI

Create successful ePaper yourself
Turn your PDF publications into a flip-book with our unique Google optimized e-Paper software.
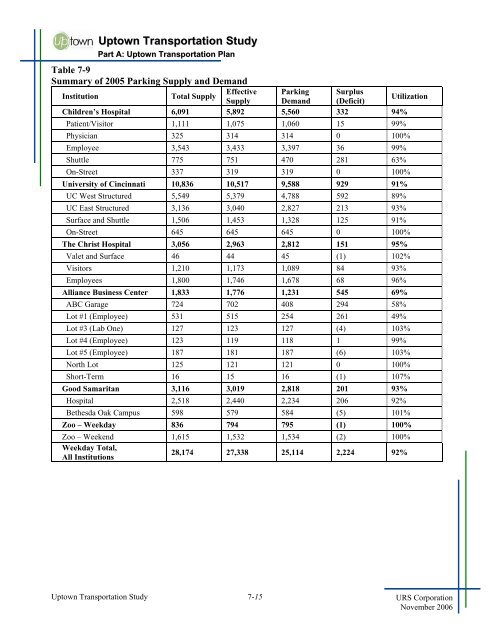
<strong>Uptown</strong> <strong>Transportation</strong> <strong>Study</strong>Part A: <strong>Uptown</strong> <strong>Transportation</strong> PlanTable 7-9Summary of 2005 Parking Supply and DemandEffective Parking SurplusInstitutionTotal SupplyUtilizationSupply Demand (Deficit)Children’s Hospital 6,091 5,892 5,560 332 94%Patient/Visitor 1,111 1,075 1,060 15 99%Physician 325 314 314 0 100%Employee 3,543 3,433 3,397 36 99%Shuttle 775 751 470 281 63%On-Street 337 319 319 0 100%University of Cincinnati 10,836 10,517 9,588 929 91%UC West Structured 5,549 5,379 4,788 592 89%UC East Structured 3,136 3,040 2,827 213 93%Surface and Shuttle 1,506 1,453 1,328 125 91%On-Street 645 645 645 0 100%The Christ Hospital 3,056 2,963 2,812 151 95%Valet and Surface 46 44 45 (1) 102%Visitors 1,210 1,173 1,089 84 93%Employees 1,800 1,746 1,678 68 96%Alliance Business Center 1,833 1,776 1,231 545 69%ABC Garage 724 702 408 294 58%Lot #1 (Employee) 531 515 254 261 49%Lot #3 (Lab One) 127 123 127 (4) 103%Lot #4 (Employee) 123 119 118 1 99%Lot #5 (Employee) 187 181 187 (6) 103%North Lot 125 121 121 0 100%Short-Term 16 15 16 (1) 107%Good Samaritan 3,116 3,019 2,818 201 93%Hospital 2,518 2,440 2,234 206 92%Bethesda Oak Campus 598 579 584 (5) 101%Zoo – Weekday 836 794 795 (1) 100%Zoo – Weekend 1,615 1,532 1,534 (2) 100%Weekday Total,All Institutions28,174 27,338 25,114 2,224 92%<strong>Uptown</strong> <strong>Transportation</strong> <strong>Study</strong> 7-15 URS CorporationNovember 2006