Boulder Valley School District Educational Facilities Master Plan
Boulder Valley School District Educational Facilities Master Plan
Boulder Valley School District Educational Facilities Master Plan

You also want an ePaper? Increase the reach of your titles
YUMPU automatically turns print PDFs into web optimized ePapers that Google loves.
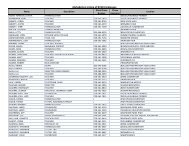
<strong>Boulder</strong> <strong>Valley</strong> <strong>School</strong> <strong>District</strong><strong>Educational</strong> <strong>Facilities</strong> <strong>Master</strong> <strong>Plan</strong><strong>School</strong> Name Level Square Year of Program Condition Combined Program May 2006Feet Original Score Score Score Capacity EnrollmentConstructionAspen Creek K-8 114478 2000 91.00% 99.00% 95.00% 969 872Eldorado K-8 114476 2000 93.00% 99.00% 96.00% 876 947Horizons K-8 29350 1959 * 56.00% 56.00% 315 318Monarch K-8 108802 1997 89.00% 99.00% 94.00% 753 705K-8 <strong>School</strong> Mean 91.00% 88.25% 85.25%Angevine Middle 121676 1989 88.00% 86.00% 87.00% 863 585Broomfield Heights Middle 107385 1983 75.00% 78.00% 76.50% 914 546Casey Middle 84007 1924 50.00% 63.00% 56.50% 612 356Centennial Middle 101008 1960 65.00% 78.00% 71.50% 750 592Halcyon Middle 8736 1955 * 45.00% 45.00% * 13Louisville Middle 89087 1939 61.00% 66.00% 63.50% 651 548Manhattan Middle 80692 1965 63.00% 52.00% 57.50% 605 444Platt Middle 117057 1958 65.00% 50.00% 57.50% 707 540Southern Hills Middle 72260 1963 56.00% 57.00% 56.50% 503 502Summit Middle 28455 1964 * 37.00% 37.00% 337 303Middle <strong>School</strong> Mean 65.38% 61.20% 60.85%Arapahoe Ridge/TEC High 121631 1965 59.00% 73.00% 66.00% 820 305<strong>Boulder</strong> High 229281 1937 84.00% 82.00% 83.00% 1994 1871Broomfield High 218163 1959 80.00% 74.00% 77.00% 1599 1369Centaurus High 188010 1973 76.00% 86.00% 81.00% 1607 972Fairview High 256392 1971 86.00% 78.00% 82.00% 1861 1847Monarch High 228827 1998 92.00% 99.00% 95.50% 1728 1601New Vista High 76805 1952 75.00% 59.00% 67.00% 659 327High <strong>School</strong> Mean 78.86% 78.71% 78.79%Peak to Peak Charter K-12 * * 71.00% * 71.00% 1200 1200Nederland Mid/Sen 97080 1971 74.00% 68.00% 71.00% 650 390Special <strong>School</strong> Mean 72.50% 68.00% 71.00%* These schools were not evaluated for their program compatibility due to their unique programdelivery. It was determined that application of adopted <strong>District</strong> educational specifications wasnot applicable to their situation. The facility condition assessment was not performed for Peakto Peak because the <strong>District</strong> does not own the campus.Capital Improvement <strong>Plan</strong>ning Committee May 2006 Page 30