Download file - Ayuntamiento de Zaragoza
Download file - Ayuntamiento de Zaragoza
Download file - Ayuntamiento de Zaragoza

Create successful ePaper yourself
Turn your PDF publications into a flip-book with our unique Google optimized e-Paper software.
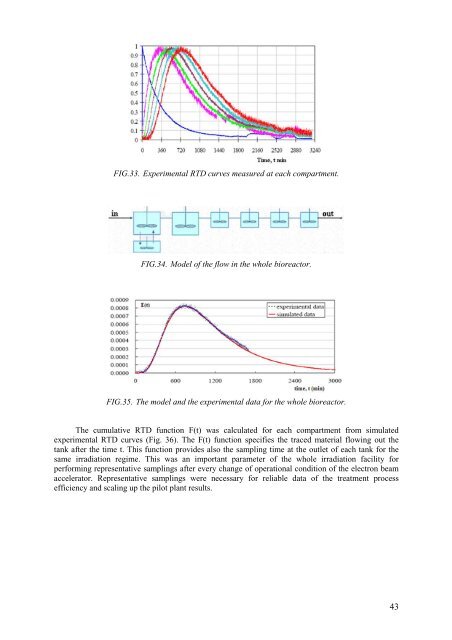
FIG.33. Experimental RTD curves measured at each compartment.FIG.34. Mo<strong>de</strong>l of the flow in the whole bioreactor.FIG.35. The mo<strong>de</strong>l and the experimental data for the whole bioreactor.The cumulative RTD function F(t) was calculated for each compartment from simulate<strong>de</strong>xperimental RTD curves (Fig. 36). The F(t) function specifies the traced material flowing out thetank after the time t. This function provi<strong>de</strong>s also the sampling time at the outlet of each tank for thesame irradiation regime. This was an important parameter of the whole irradiation facility forperforming representative samplings after every change of operational condition of the electron beamaccelerator. Representative samplings were necessary for reliable data of the treatment processefficiency and scaling up the pilot plant results.43