Download file - Ayuntamiento de Zaragoza
Download file - Ayuntamiento de Zaragoza
Download file - Ayuntamiento de Zaragoza

Create successful ePaper yourself
Turn your PDF publications into a flip-book with our unique Google optimized e-Paper software.
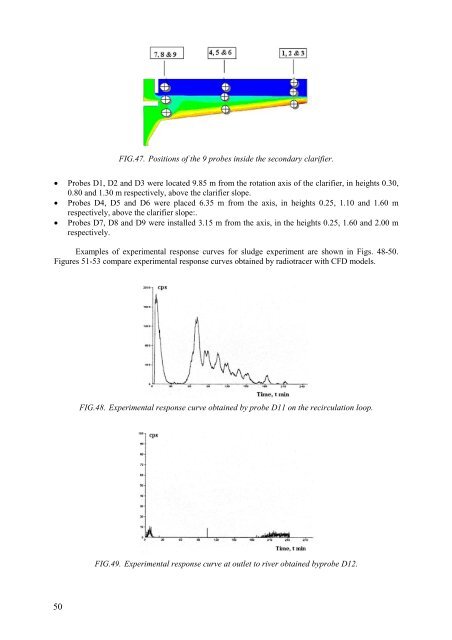
FIG.47. Positions of the 9 probes insi<strong>de</strong> the secondary clarifier.• Probes D1, D2 and D3 were located 9.85 m from the rotation axis of the clarifier, in heights 0.30,0.80 and 1.30 m respectively, above the clarifier slope.• Probes D4, D5 and D6 were placed 6.35 m from the axis, in heights 0.25, 1.10 and 1.60 mrespectively, above the clarifier slope:.• Probes D7, D8 and D9 were installed 3.15 m from the axis, in the heights 0.25, 1.60 and 2.00 mrespectively.Examples of experimental response curves for sludge experiment are shown in Figs. 48-50.Figures 51-53 compare experimental response curves obtained by radiotracer with CFD mo<strong>de</strong>ls.FIG.48. Experimental response curve obtained by probe D11 on the recirculation loop.FIG.49. Experimental response curve at outlet to river obtained byprobe D12.50