Download file - Ayuntamiento de Zaragoza
Download file - Ayuntamiento de Zaragoza
Download file - Ayuntamiento de Zaragoza

You also want an ePaper? Increase the reach of your titles
YUMPU automatically turns print PDFs into web optimized ePapers that Google loves.
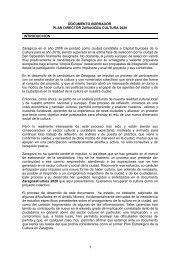
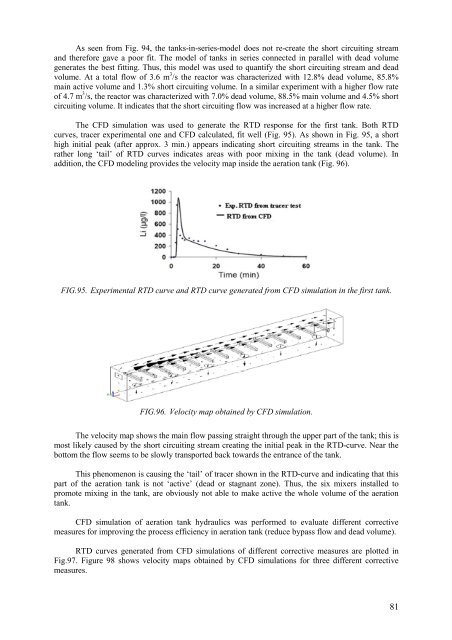
As seen from Fig. 94, the tanks-in-series-mo<strong>de</strong>l does not re-create the short circuiting streamand therefore gave a poor fit. The mo<strong>de</strong>l of tanks in series connected in parallel with <strong>de</strong>ad volumegenerates the best fitting. Thus, this mo<strong>de</strong>l was used to quantify the short circuiting stream and <strong>de</strong>advolume. At a total flow of 3.6 m 3 /s the reactor was characterized with 12.8% <strong>de</strong>ad volume, 85.8%main active volume and 1.3% short circuiting volume. In a similar experiment with a higher flow rateof 4.7 m 3 /s, the reactor was characterized with 7.0% <strong>de</strong>ad volume, 88.5% main volume and 4.5% shortcircuiting volume. It indicates that the short circuiting flow was increased at a higher flow rate.The CFD simulation was used to generate the RTD response for the first tank. Both RTDcurves, tracer experimental one and CFD calculated, fit well (Fig. 95). As shown in Fig. 95, a shorthigh initial peak (after approx. 3 min.) appears indicating short circuiting streams in the tank. Therather long ‘tail’ of RTD curves indicates areas with poor mixing in the tank (<strong>de</strong>ad volume). Inaddition, the CFD mo<strong>de</strong>ling provi<strong>de</strong>s the velocity map insi<strong>de</strong> the aeration tank (Fig. 96).FIG.95. Experimental RTD curve and RTD curve generated from CFD simulation in the first tank.FIG.96. Velocity map obtained by CFD simulation.The velocity map shows the main flow passing straight through the upper part of the tank; this ismost likely caused by the short circuiting stream creating the initial peak in the RTD-curve. Near thebottom the flow seems to be slowly transported back towards the entrance of the tank.This phenomenon is causing the ‘tail’ of tracer shown in the RTD-curve and indicating that thispart of the aeration tank is not ‘active’ (<strong>de</strong>ad or stagnant zone). Thus, the six mixers installed topromote mixing in the tank, are obviously not able to make active the whole volume of the aerationtank.CFD simulation of aeration tank hydraulics was performed to evaluate different correctivemeasures for improving the process efficiency in aeration tank (reduce bypass flow and <strong>de</strong>ad volume).RTD curves generated from CFD simulations of different corrective measures are plotted inFig.97. Figure 98 shows velocity maps obtained by CFD simulations for three different correctivemeasures.81