Download file - Ayuntamiento de Zaragoza
Download file - Ayuntamiento de Zaragoza
Download file - Ayuntamiento de Zaragoza

You also want an ePaper? Increase the reach of your titles
YUMPU automatically turns print PDFs into web optimized ePapers that Google loves.
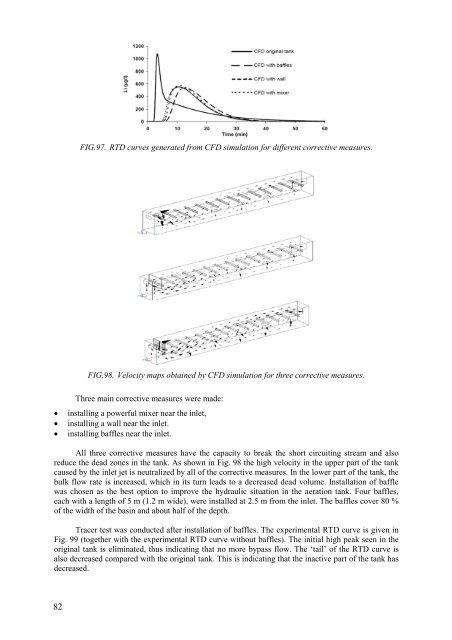
FIG.97. RTD curves generated from CFD simulation for different corrective measures.FIG.98. Velocity maps obtained by CFD simulation for three corrective measures.Three main corrective measures were ma<strong>de</strong>:• installing a powerful mixer near the inlet,• installing a wall near the inlet.• installing baffles near the inlet.All three corrective measures have the capacity to break the short circuiting stream and alsoreduce the <strong>de</strong>ad zones in the tank. As shown in Fig. 98 the high velocity in the upper part of the tankcaused by the inlet jet is neutralized by all of the corrective measures. In the lower part of the tank, thebulk flow rate is increased, which in its turn leads to a <strong>de</strong>creased <strong>de</strong>ad volume. Installation of bafflewas chosen as the best option to improve the hydraulic situation in the aeration tank. Four baffles,each with a length of 5 m (1.2 m wi<strong>de</strong>), were installed at 2.5 m from the inlet. The baffles cover 80 %of the width of the basin and about half of the <strong>de</strong>pth.Tracer test was conducted after installation of baffles. The experimental RTD curve is given inFig. 99 (together with the experimental RTD curve without baffles). The initial high peak seen in theoriginal tank is eliminated, thus indicating that no more bypass flow. The ‘tail’ of the RTD curve isalso <strong>de</strong>creased compared with the original tank. This is indicating that the inactive part of the tank has<strong>de</strong>creased.82