Download file - Ayuntamiento de Zaragoza
Download file - Ayuntamiento de Zaragoza
Download file - Ayuntamiento de Zaragoza

Create successful ePaper yourself
Turn your PDF publications into a flip-book with our unique Google optimized e-Paper software.
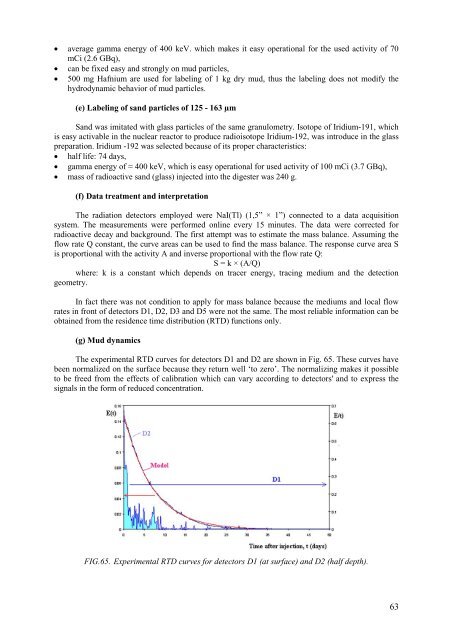
• average gamma energy of 400 keV. which makes it easy operational for the used activity of 70mCi (2.6 GBq),• can be fixed easy and strongly on mud particles,• 500 mg Hafnium are used for labeling of 1 kg dry mud, thus the labeling does not modify thehydrodynamic behavior of mud particles.(e) Labeling of sand particles of 125 - 163 µmSand was imitated with glass particles of the same granulometry. Isotope of Iridium-191, whichis easy activable in the nuclear reactor to produce radioisotope Iridium-192, was introduce in the glasspreparation. Iridium -192 was selected because of its proper characteristics:• half life: 74 days,• gamma energy of ≈ 400 keV, which is easy operational for used activity of 100 mCi (3.7 GBq),• mass of radioactive sand (glass) injected into the digester was 240 g.(f) Data treatment and interpretationThe radiation <strong>de</strong>tectors employed were NaI(Tl) (1,5” × 1”) connected to a data acquisitionsystem. The measurements were performed online every 15 minutes. The data were corrected forradioactive <strong>de</strong>cay and background. The first attempt was to estimate the mass balance. Assuming theflow rate Q constant, the curve areas can be used to find the mass balance. The response curve area Sis proportional with the activity A and inverse proportional with the flow rate Q:S = k × (A/Q)where: k is a constant which <strong>de</strong>pends on tracer energy, tracing medium and the <strong>de</strong>tectiongeometry.In fact there was not condition to apply for mass balance because the mediums and local flowrates in front of <strong>de</strong>tectors D1, D2, D3 and D5 were not the same. The most reliable information can beobtained from the resi<strong>de</strong>nce time distribution (RTD) functions only.(g) Mud dynamicsThe experimental RTD curves for <strong>de</strong>tectors D1 and D2 are shown in Fig. 65. These curves havebeen normalized on the surface because they return well ‘to zero’. The normalizing makes it possibleto be freed from the effects of calibration which can vary according to <strong>de</strong>tectors' and to express thesignals in the form of reduced concentration.FIG.65. Experimental RTD curves for <strong>de</strong>tectors D1 (at surface) and D2 (half <strong>de</strong>pth).63