Download file - Ayuntamiento de Zaragoza
Download file - Ayuntamiento de Zaragoza
Download file - Ayuntamiento de Zaragoza

You also want an ePaper? Increase the reach of your titles
YUMPU automatically turns print PDFs into web optimized ePapers that Google loves.
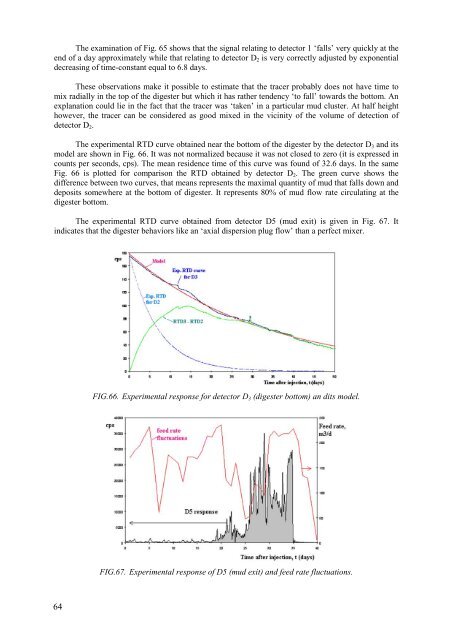
The examination of Fig. 65 shows that the signal relating to <strong>de</strong>tector 1 ‘falls’ very quickly at theend of a day approximately while that relating to <strong>de</strong>tector D 2 is very correctly adjusted by exponential<strong>de</strong>creasing of time-constant equal to 6.8 days.These observations make it possible to estimate that the tracer probably does not have time tomix radially in the top of the digester but which it has rather ten<strong>de</strong>ncy ‘to fall’ towards the bottom. Anexplanation could lie in the fact that the tracer was ‘taken’ in a particular mud cluster. At half heighthowever, the tracer can be consi<strong>de</strong>red as good mixed in the vicinity of the volume of <strong>de</strong>tection of<strong>de</strong>tector D 2 .The experimental RTD curve obtained near the bottom of the digester by the <strong>de</strong>tector D 3 and itsmo<strong>de</strong>l are shown in Fig. 66. It was not normalized because it was not closed to zero (it is expressed incounts per seconds, cps). The mean resi<strong>de</strong>nce time of this curve was found of 32.6 days. In the sameFig. 66 is plotted for comparison the RTD obtained by <strong>de</strong>tector D 2 . The green curve shows thedifference between two curves, that means represents the maximal quantity of mud that falls down and<strong>de</strong>posits somewhere at the bottom of digester. It represents 80% of mud flow rate circulating at thedigester bottom.The experimental RTD curve obtained from <strong>de</strong>tector D5 (mud exit) is given in Fig. 67. Itindicates that the digester behaviors like an ‘axial dispersion plug flow’ than a perfect mixer.FIG.66. Experimental response for <strong>de</strong>tector D 3 (digester bottom) an dits mo<strong>de</strong>l.FIG.67. Experimental response of D5 (mud exit) and feed rate fluctuations.64