Download file - Ayuntamiento de Zaragoza
Download file - Ayuntamiento de Zaragoza
Download file - Ayuntamiento de Zaragoza

Create successful ePaper yourself
Turn your PDF publications into a flip-book with our unique Google optimized e-Paper software.
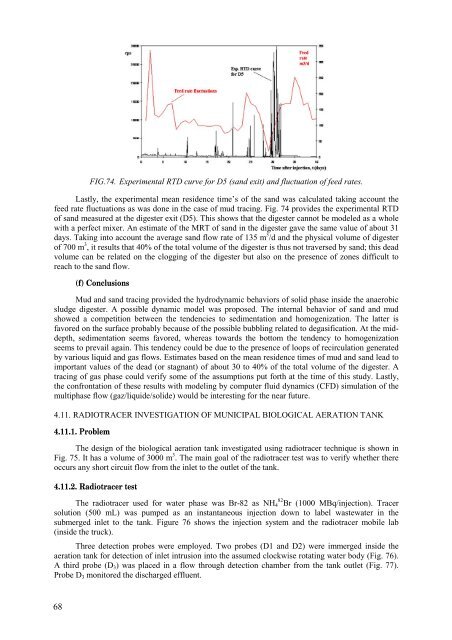
FIG.74. Experimental RTD curve for D5 (sand exit) and fluctuation of feed rates.Lastly, the experimental mean resi<strong>de</strong>nce time’s of the sand was calculated taking account thefeed rate fluctuations as was done in the case of mud tracing. Fig. 74 provi<strong>de</strong>s the experimental RTDof sand measured at the digester exit (D5). This shows that the digester cannot be mo<strong>de</strong>led as a wholewith a perfect mixer. An estimate of the MRT of sand in the digester gave the same value of about 31days. Taking into account the average sand flow rate of 135 m 3 /d and the physical volume of digesterof 700 m 3 , it results that 40% of the total volume of the digester is thus not traversed by sand; this <strong>de</strong>advolume can be related on the clogging of the digester but also on the presence of zones difficult toreach to the sand flow.(f) ConclusionsMud and sand tracing provi<strong>de</strong>d the hydrodynamic behaviors of solid phase insi<strong>de</strong> the anaerobicsludge digester. A possible dynamic mo<strong>de</strong>l was proposed. The internal behavior of sand and mudshowed a competition between the ten<strong>de</strong>ncies to sedimentation and homogenization. The latter isfavored on the surface probably because of the possible bubbling related to <strong>de</strong>gasification. At the mid<strong>de</strong>pth,sedimentation seems favored, whereas towards the bottom the ten<strong>de</strong>ncy to homogenizationseems to prevail again. This ten<strong>de</strong>ncy could be due to the presence of loops of recirculation generatedby various liquid and gas flows. Estimates based on the mean resi<strong>de</strong>nce times of mud and sand lead toimportant values of the <strong>de</strong>ad (or stagnant) of about 30 to 40% of the total volume of the digester. Atracing of gas phase could verify some of the assumptions put forth at the time of this study. Lastly,the confrontation of these results with mo<strong>de</strong>ling by computer fluid dynamics (CFD) simulation of themultiphase flow (gaz/liqui<strong>de</strong>/soli<strong>de</strong>) would be interesting for the near future.4.11. RADIOTRACER INVESTIGATION OF MUNICIPAL BIOLOGICAL AERATION TANK4.11.1. ProblemThe <strong>de</strong>sign of the biological aeration tank investigated using radiotracer technique is shown inFig. 75. It has a volume of 3000 m 3 . The main goal of the radiotracer test was to verify whether thereoccurs any short circuit flow from the inlet to the outlet of the tank.4.11.2. Radiotracer testThe radiotracer used for water phase was Br-82 as NH 4 82 Br (1000 MBq/injection). Tracersolution (500 mL) was pumped as an instantaneous injection down to label wastewater in thesubmerged inlet to the tank. Figure 76 shows the injection system and the radiotracer mobile lab(insi<strong>de</strong> the truck).Three <strong>de</strong>tection probes were employed. Two probes (D1 and D2) were immerged insi<strong>de</strong> theaeration tank for <strong>de</strong>tection of inlet intrusion into the assumed clockwise rotating water body (Fig. 76).A third probe (D 3 ) was placed in a flow through <strong>de</strong>tection chamber from the tank outlet (Fig. 77).Probe D 3 monitored the discharged effluent.68