Download file - Ayuntamiento de Zaragoza
Download file - Ayuntamiento de Zaragoza
Download file - Ayuntamiento de Zaragoza

Create successful ePaper yourself
Turn your PDF publications into a flip-book with our unique Google optimized e-Paper software.
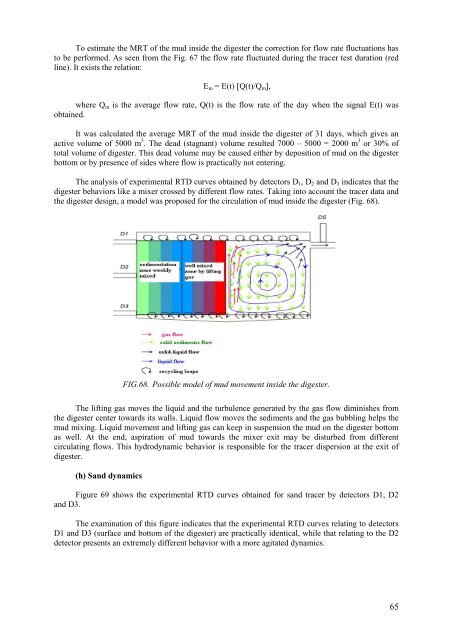
To estimate the MRT of the mud insi<strong>de</strong> the digester the correction for flow rate fluctuations hasto be performed. As seen from the Fig. 67 the flow rate fluctuated during the tracer test duration (redline). It exists the relation:E m = E(t) [Q(t)/Q m ],where Q m is the average flow rate, Q(t) is the flow rate of the day when the signal E(t) wasobtained.It was calculated the average MRT of the mud insi<strong>de</strong> the digester of 31 days, which gives anactive volume of 5000 m 3 . The <strong>de</strong>ad (stagnant) volume resulted 7000 – 5000 = 2000 m 3 or 30% oftotal volume of digester. This <strong>de</strong>ad volume may be caused either by <strong>de</strong>position of mud on the digesterbottom or by presence of si<strong>de</strong>s where flow is practically not entering.The analysis of experimental RTD curves obtained by <strong>de</strong>tectors D 1 , D 2 and D 3 indicates that thedigester behaviors like a mixer crossed by different flow rates. Taking into account the tracer data andthe digester <strong>de</strong>sign, a mo<strong>de</strong>l was proposed for the circulation of mud insi<strong>de</strong> the digester (Fig. 68).FIG.68. Possible mo<strong>de</strong>l of mud movement insi<strong>de</strong> the digester.The lifting gas moves the liquid and the turbulence generated by the gas flow diminishes fromthe digester center towards its walls. Liquid flow moves the sediments and the gas bubbling helps themud mixing. Liquid movement and lifting gas can keep in suspension the mud on the digester bottomas well. At the end, aspiration of mud towards the mixer exit may be disturbed from differentcirculating flows. This hydrodynamic behavior is responsible for the tracer dispersion at the exit ofdigester.(h) Sand dynamicsFigure 69 shows the experimental RTD curves obtained for sand tracer by <strong>de</strong>tectors D1, D2and D3.The examination of this figure indicates that the experimental RTD curves relating to <strong>de</strong>tectorsD1 and D3 (surface and bottom of the digester) are practically i<strong>de</strong>ntical, while that relating to the D2<strong>de</strong>tector presents an extremely different behavior with a more agitated dynamics.65