Source Zone Delineation Demonstration Report - Triad Resource ...
Source Zone Delineation Demonstration Report - Triad Resource ...
Source Zone Delineation Demonstration Report - Triad Resource ...
Create successful ePaper yourself
Turn your PDF publications into a flip-book with our unique Google optimized e-Paper software.
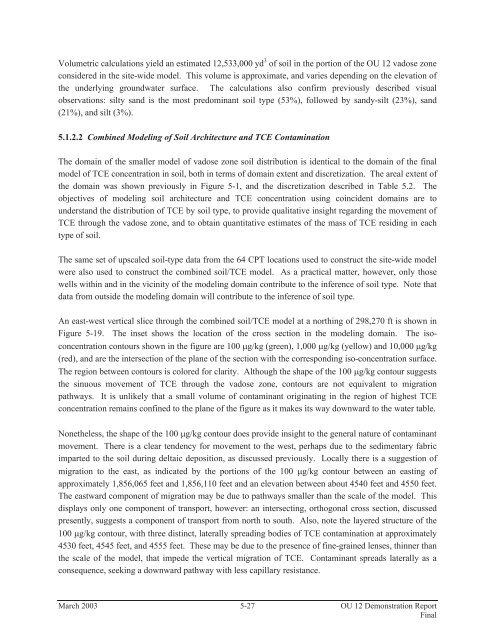
Volumetric calculations yield an estimated 12,533,000 yd 3 of soil in the portion of the OU 12 vadose zoneconsidered in the site-wide model. This volume is approximate, and varies depending on the elevation ofthe underlying groundwater surface. The calculations also confirm previously described visualobservations: silty sand is the most predominant soil type (53%), followed by sandy-silt (23%), sand(21%), and silt (3%).5.1.2.2 Combined Modeling of Soil Architecture and TCE ContaminationThe domain of the smaller model of vadose zone soil distribution is identical to the domain of the finalmodel of TCE concentration in soil, both in terms of domain extent and discretization. The areal extent ofthe domain was shown previously in Figure 5-1, and the discretization described in Table 5.2. Theobjectives of modeling soil architecture and TCE concentration using coincident domains are tounderstand the distribution of TCE by soil type, to provide qualitative insight regarding the movement ofTCE through the vadose zone, and to obtain quantitative estimates of the mass of TCE residing in eachtype of soil.The same set of upscaled soil-type data from the 64 CPT locations used to construct the site-wide modelwere also used to construct the combined soil/TCE model. As a practical matter, however, only thosewells within and in the vicinity of the modeling domain contribute to the inference of soil type. Note thatdata from outside the modeling domain will contribute to the inference of soil type.An east-west vertical slice through the combined soil/TCE model at a northing of 298,270 ft is shown inFigure 5-19. The inset shows the location of the cross section in the modeling domain. The isoconcentrationcontours shown in the figure are 100 g/kg (green), 1,000 g/kg (yellow) and 10,000 g/kg(red), and are the intersection of the plane of the section with the corresponding iso-concentration surface.The region between contours is colored for clarity. Although the shape of the 100 g/kg contour suggeststhe sinuous movement of TCE through the vadose zone, contours are not equivalent to migrationpathways. It is unlikely that a small volume of contaminant originating in the region of highest TCEconcentration remains confined to the plane of the figure as it makes its way downward to the water table.Nonetheless, the shape of the 100 g/kg contour does provide insight to the general nature of contaminantmovement. There is a clear tendency for movement to the west, perhaps due to the sedimentary fabricimparted to the soil during deltaic deposition, as discussed previously. Locally there is a suggestion ofmigration to the east, as indicated by the portions of the 100 g/kg contour between an easting ofapproximately 1,856,065 feet and 1,856,110 feet and an elevation between about 4540 feet and 4550 feet.The eastward component of migration may be due to pathways smaller than the scale of the model. Thisdisplays only one component of transport, however: an intersecting, orthogonal cross section, discussedpresently, suggests a component of transport from north to south. Also, note the layered structure of the100 g/kg contour, with three distinct, laterally spreading bodies of TCE contamination at approximately4530 feet, 4545 feet, and 4555 feet. These may be due to the presence of fine-grained lenses, thinner thanthe scale of the model, that impede the vertical migration of TCE. Contaminant spreads laterally as aconsequence, seeking a downward pathway with less capillary resistance.March 2003 5-27 OU 12 <strong>Demonstration</strong> <strong>Report</strong>Final


