Source Zone Delineation Demonstration Report - Triad Resource ...
Source Zone Delineation Demonstration Report - Triad Resource ...
Source Zone Delineation Demonstration Report - Triad Resource ...
Create successful ePaper yourself
Turn your PDF publications into a flip-book with our unique Google optimized e-Paper software.
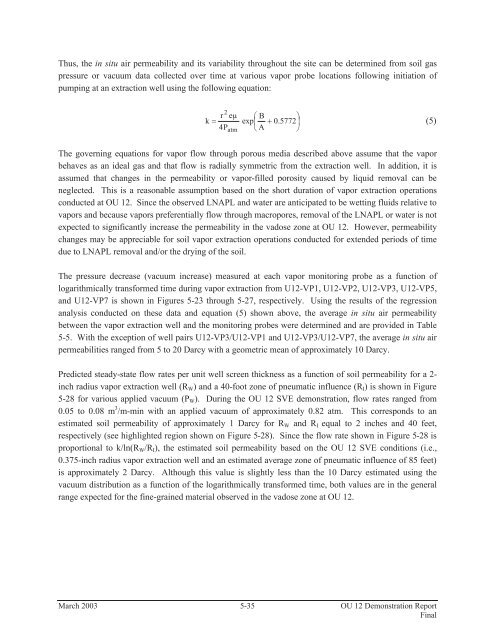
Thus, the in situ air permeability and its variability throughout the site can be determined from soil gaspressure or vacuum data collected over time at various vapor probe locations following initiation ofpumping at an extraction well using the following equation:2r eμ B k exp 0.57724Patm A (5)The governing equations for vapor flow through porous media described above assume that the vaporbehaves as an ideal gas and that flow is radially symmetric from the extraction well. In addition, it isassumed that changes in the permeability or vapor-filled porosity caused by liquid removal can beneglected. This is a reasonable assumption based on the short duration of vapor extraction operationsconducted at OU 12. Since the observed LNAPL and water are anticipated to be wetting fluids relative tovapors and because vapors preferentially flow through macropores, removal of the LNAPL or water is notexpected to significantly increase the permeability in the vadose zone at OU 12. However, permeabilitychanges may be appreciable for soil vapor extraction operations conducted for extended periods of timedue to LNAPL removal and/or the drying of the soil.The pressure decrease (vacuum increase) measured at each vapor monitoring probe as a function oflogarithmically transformed time during vapor extraction from U12-VP1, U12-VP2, U12-VP3, U12-VP5,and U12-VP7 is shown in Figures 5-23 through 5-27, respectively. Using the results of the regressionanalysis conducted on these data and equation (5) shown above, the average in situ air permeabilitybetween the vapor extraction well and the monitoring probes were determined and are provided in Table5-5. With the exception of well pairs U12-VP3/U12-VP1 and U12-VP3/U12-VP7, the average in situ airpermeabilities ranged from 5 to 20 Darcy with a geometric mean of approximately 10 Darcy.Predicted steady-state flow rates per unit well screen thickness as a function of soil permeability for a 2-inch radius vapor extraction well (R W ) and a 40-foot zone of pneumatic influence (R I ) is shown in Figure5-28 for various applied vacuum (P W ). During the OU 12 SVE demonstration, flow rates ranged from0.05 to 0.08 m 3 /m-min with an applied vacuum of approximately 0.82 atm. This corresponds to anestimated soil permeability of approximately 1 Darcy for R W and R I equal to 2 inches and 40 feet,respectively (see highlighted region shown on Figure 5-28). Since the flow rate shown in Figure 5-28 isproportional to k/ln(R W /R I ), the estimated soil permeability based on the OU 12 SVE conditions (i.e.,0.375-inch radius vapor extraction well and an estimated average zone of pneumatic influence of 85 feet)is approximately 2 Darcy. Although this value is slightly less than the 10 Darcy estimated using thevacuum distribution as a function of the logarithmically transformed time, both values are in the generalrange expected for the fine-grained material observed in the vadose zone at OU 12.March 2003 5-35 OU 12 <strong>Demonstration</strong> <strong>Report</strong>Final


