Management of the Diamondback Moth and Other Crucifer Insect ...
Management of the Diamondback Moth and Other Crucifer Insect ...
Management of the Diamondback Moth and Other Crucifer Insect ...

You also want an ePaper? Increase the reach of your titles
YUMPU automatically turns print PDFs into web optimized ePapers that Google loves.
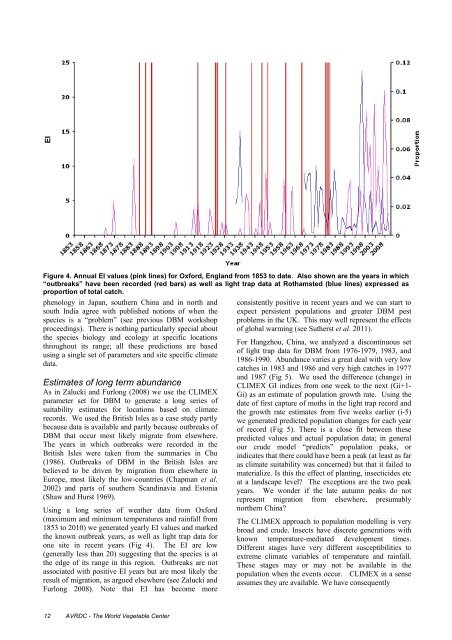
EIFigure 4. Annual EI values (pink lines) for Oxford, Engl<strong>and</strong> from 1853 to date. Also shown are <strong>the</strong> years in which“outbreaks” have been recorded (red bars) as well as light trap data at Rothamsted (blue lines) expressed asproportion <strong>of</strong> total catch.phenology in Japan, sou<strong>the</strong>rn China <strong>and</strong> in north <strong>and</strong>south India agree with published notions <strong>of</strong> when <strong>the</strong>species is a “problem” (see previous DBM workshopproceedings). There is nothing particularly special about<strong>the</strong> species biology <strong>and</strong> ecology at specific locationsthroughout its range; all <strong>the</strong>se predictions are basedusing a single set <strong>of</strong> parameters <strong>and</strong> site specific climatedata.Estimates <strong>of</strong> long term abundanceAs in Zalucki <strong>and</strong> Furlong (2008) we use <strong>the</strong> CLIMEXparameter set for DBM to generate a long series <strong>of</strong>suitability estimates for locations based on climaterecords. We used <strong>the</strong> British Isles as a case study partlybecause data is available <strong>and</strong> partly because outbreaks <strong>of</strong>DBM that occur most likely migrate from elsewhere.The years in which outbreaks were recorded in <strong>the</strong>British Isles were taken from <strong>the</strong> summaries in Chu(1986). Outbreaks <strong>of</strong> DBM in <strong>the</strong> British Isles arebelieved to be driven by migration from elsewhere inEurope, most likely <strong>the</strong> low-countries (Chapman et al.2002) <strong>and</strong> parts <strong>of</strong> sou<strong>the</strong>rn Sc<strong>and</strong>inavia <strong>and</strong> Estonia(Shaw <strong>and</strong> Hurst 1969).Using a long series <strong>of</strong> wea<strong>the</strong>r data from Oxford(maximum <strong>and</strong> minimum temperatures <strong>and</strong> rainfall from1853 to 2010) we generated yearly EI values <strong>and</strong> marked<strong>the</strong> known outbreak years, as well as light trap data forone site in recent years (Fig 4). The EI are low(generally less than 20) suggesting that <strong>the</strong> species is at<strong>the</strong> edge <strong>of</strong> its range in this region. Outbreaks are notassociated with positive EI years but are most likely <strong>the</strong>result <strong>of</strong> migration, as argued elsewhere (see Zalucki <strong>and</strong>Furlong 2008). Note that EI has become moreconsistently positive in recent years <strong>and</strong> we can start toexpect persistent populations <strong>and</strong> greater DBM pestproblems in <strong>the</strong> UK. This may well represent <strong>the</strong> effects<strong>of</strong> global warming (see Su<strong>the</strong>rst et al. 2011).For Hangzhou, China, we analyzed a discontinuous set<strong>of</strong> light trap data for DBM from 1976-1979, 1983, <strong>and</strong>1986-1990. Abundance varies a great deal with very lowcatches in 1983 <strong>and</strong> 1986 <strong>and</strong> very high catches in 1977<strong>and</strong> 1987 (Fig 5). We used <strong>the</strong> difference (change) inCLIMEX GI indices from one week to <strong>the</strong> next (Gi+1-Gi) as an estimate <strong>of</strong> population growth rate. Using <strong>the</strong>date <strong>of</strong> first capture <strong>of</strong> moths in <strong>the</strong> light trap record <strong>and</strong><strong>the</strong> growth rate estimates from five weeks earlier (i-5)we generated predicted population changes for each year<strong>of</strong> record (Fig 5). There is a close fit between <strong>the</strong>sepredicted values <strong>and</strong> actual population data; in generalour crude model “predicts” population peaks, orindicates that <strong>the</strong>re could have been a peak (at least as faras climate suitability was concerned) but that it failed tomaterialize. Is this <strong>the</strong> effect <strong>of</strong> planting, insecticides etcat a l<strong>and</strong>scape level? The exceptions are <strong>the</strong> two peakyears. We wonder if <strong>the</strong> late autumn peaks do notrepresent migration from elsewhere, presumablynor<strong>the</strong>rn China?The CLIMEX approach to population modelling is verybroad <strong>and</strong> crude. <strong>Insect</strong>s have discrete generations withknown temperature-mediated development times.Different stages have very different susceptibilities toextreme climate variables <strong>of</strong> temperature <strong>and</strong> rainfall.These stages may or may not be available in <strong>the</strong>population when <strong>the</strong> events occur. CLIMEX in a senseassumes <strong>the</strong>y are available. We have consequently12 AVRDC - The World Vegetable Center