LOWER ZAMBEZI RIVER BASIN BASELINE DATA ON LANDUSE ...
LOWER ZAMBEZI RIVER BASIN BASELINE DATA ON LANDUSE ...
LOWER ZAMBEZI RIVER BASIN BASELINE DATA ON LANDUSE ...

Create successful ePaper yourself
Turn your PDF publications into a flip-book with our unique Google optimized e-Paper software.
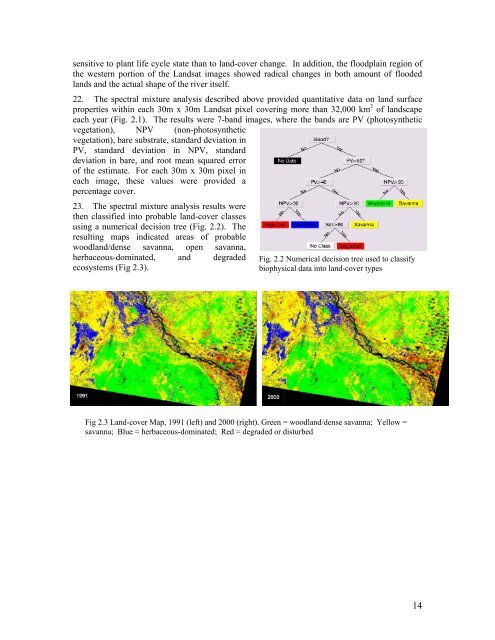
sensitive to plant life cycle state than to land-cover change. In addition, the floodplain region ofthe western portion of the Landsat images showed radical changes in both amount of floodedlands and the actual shape of the river itself.22. The spectral mixture analysis described above provided quantitative data on land surfaceproperties within each 30m x 30m Landsat pixel covering more than 32,000 km 2 of landscapeeach year (Fig. 2.1). The results were 7-band images, where the bands are PV (photosyntheticvegetation), NPV (non-photosyntheticvegetation), bare substrate, standard deviation inPV, standard deviation in NPV, standarddeviation in bare, and root mean squared errorof the estimate. For each 30m x 30m pixel ineach image, these values were provided apercentage cover.23. The spectral mixture analysis results werethen classified into probable land-cover classesusing a numerical decision tree (Fig. 2.2). Theresulting maps indicated areas of probablewoodland/dense savanna, open savanna,herbaceous-dominated, and degradedecosystems (Fig 2.3).Fig. 2.2 Numerical decision tree used to classifybiophysical data into land-cover typesFig 2.3 Land-cover Map, 1991 (left) and 2000 (right). Green = woodland/dense savanna; Yellow =savanna; Blue = herbaceous-dominated; Red = degraded or disturbed14