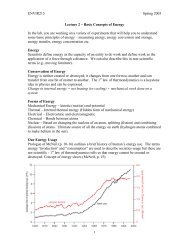
LOWER ZAMBEZI RIVER BASIN BASELINE DATA ON LANDUSE ...
LOWER ZAMBEZI RIVER BASIN BASELINE DATA ON LANDUSE ...
LOWER ZAMBEZI RIVER BASIN BASELINE DATA ON LANDUSE ...

Create successful ePaper yourself
Turn your PDF publications into a flip-book with our unique Google optimized e-Paper software.
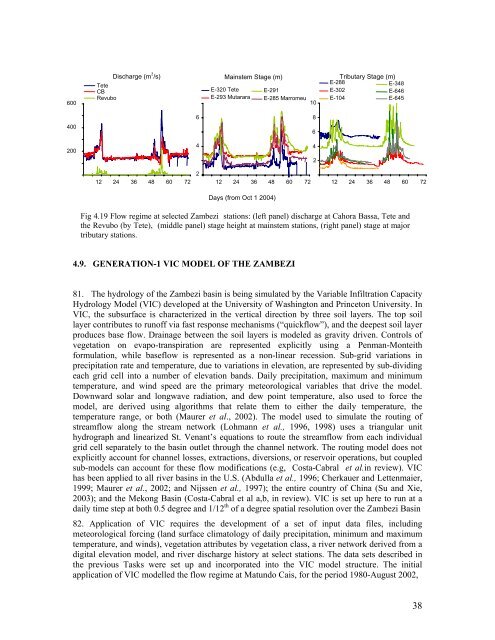
600TeteCBRevuboDischarge (m 3 /s)Mainstem Stage (m)E-320 TeteE-293 MutararaE-291E-285 Marromeu10E-288E-302E-104Tributary Stage (m)E-348E-646E-64540020064864212 24 36 48 60 72212 24 36 48 60 7212 24 36 48 60 72Days (from Oct 1 2004)Fig 4.19 Flow regime at selected Zambezi stations: (left panel) discharge at Cahora Bassa, Tete andthe Revubo (by Tete), (middle panel) stage height at mainstem stations, (right panel) stage at majortributary stations.4.9. GENERATI<strong>ON</strong>-1 VIC MODEL OF THE <strong>ZAMBEZI</strong>81. The hydrology of the Zambezi basin is being simulated by the Variable Infiltration CapacityHydrology Model (VIC) developed at the University of Washington and Princeton University. InVIC, the subsurface is characterized in the vertical direction by three soil layers. The top soillayer contributes to runoff via fast response mechanisms (“quickflow”), and the deepest soil layerproduces base flow. Drainage between the soil layers is modeled as gravity driven. Controls ofvegetation on evapo-transpiration are represented explicitly using a Penman-Monteithformulation, while baseflow is represented as a non-linear recession. Sub-grid variations inprecipitation rate and temperature, due to variations in elevation, are represented by sub-dividingeach grid cell into a number of elevation bands. Daily precipitation, maximum and minimumtemperature, and wind speed are the primary meteorological variables that drive the model.Downward solar and longwave radiation, and dew point temperature, also used to force themodel, are derived using algorithms that relate them to either the daily temperature, thetemperature range, or both (Maurer et al., 2002). The model used to simulate the routing ofstreamflow along the stream network (Lohmann et al., 1996, 1998) uses a triangular unithydrograph and linearized St. Venant’s equations to route the streamflow from each individualgrid cell separately to the basin outlet through the channel network. The routing model does notexplicitly account for channel losses, extractions, diversions, or reservoir operations, but coupledsub-models can account for these flow modifications (e.g, Costa-Cabral et al.in review). VIChas been applied to all river basins in the U.S. (Abdulla et al., 1996; Cherkauer and Lettenmaier,1999; Maurer et al., 2002; and Nijssen et al., 1997); the entire country of China (Su and Xie,2003); and the Mekong Basin (Costa-Cabral et al a,b, in review). VIC is set up here to run at adaily time step at both 0.5 degree and 1/12 th of a degree spatial resolution over the Zambezi Basin82. Application of VIC requires the development of a set of input data files, includingmeteorological forcing (land surface climatology of daily precipitation, minimum and maximumtemperature, and winds), vegetation attributes by vegetation class, a river network derived from adigital elevation model, and river discharge history at select stations. The data sets described inthe previous Tasks were set up and incorporated into the VIC model structure. The initialapplication of VIC modelled the flow regime at Matundo Cais, for the period 1980-August 2002,38