LOWER ZAMBEZI RIVER BASIN BASELINE DATA ON LANDUSE ...
LOWER ZAMBEZI RIVER BASIN BASELINE DATA ON LANDUSE ...
LOWER ZAMBEZI RIVER BASIN BASELINE DATA ON LANDUSE ...

Create successful ePaper yourself
Turn your PDF publications into a flip-book with our unique Google optimized e-Paper software.
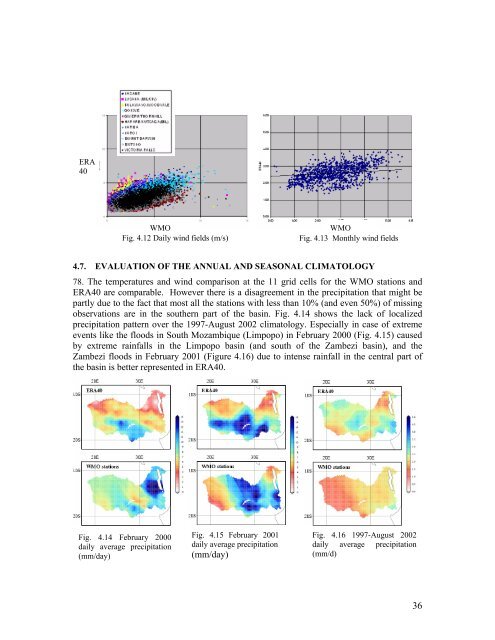
ERA40WMOFig. 4.12 Daily wind fields (m/s)WMOFig. 4.13 Monthly wind fields4.7. EVALUATI<strong>ON</strong> OF THE ANNUAL AND SEAS<strong>ON</strong>AL CLIMATOLOGY78. The temperatures and wind comparison at the 11 grid cells for the WMO stations andERA40 are comparable. However there is a disagreement in the precipitation that might bepartly due to the fact that most all the stations with less than 10% (and even 50%) of missingobservations are in the southern part of the basin. Fig. 4.14 shows the lack of localizedprecipitation pattern over the 1997-August 2002 climatology. Especially in case of extremeevents like the floods in South Mozambique (Limpopo) in February 2000 (Fig. 4.15) causedby extreme rainfalls in the Limpopo basin (and south of the Zambezi basin), and theZambezi floods in February 2001 (Figure 4.16) due to intense rainfall in the central part ofthe basin is better represented in ERA40.Fig. 4.14 February 2000daily average precipitation(mm/day)Fig. 4.15 February 2001daily average precipitation(mm/day)Fig. 4.16 1997-August 2002daily average precipitation(mm/d)36