LHW Systems Review - Oxford Policy Management
LHW Systems Review - Oxford Policy Management
LHW Systems Review - Oxford Policy Management
Create successful ePaper yourself
Turn your PDF publications into a flip-book with our unique Google optimized e-Paper software.
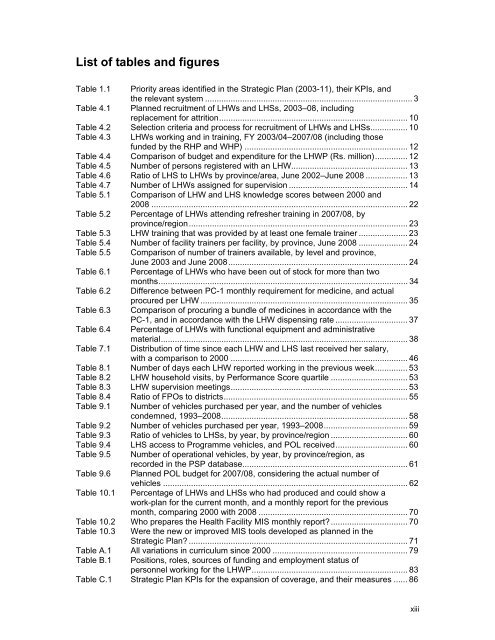
List of tables and figuresTable 1.1 Priority areas identified in the Strategic Plan (2003-11), their KPIs, andthe relevant system ......................................................................................... 3Table 4.1 Planned recruitment of <strong>LHW</strong>s and LHSs, 2003–08, includingreplacement for attrition ................................................................................. 10Table 4.2 Selection criteria and process for recruitment of <strong>LHW</strong>s and LHSs ................ 10Table 4.3 <strong>LHW</strong>s working and in training, FY 2003/04–2007/08 (including thosefunded by the RHP and WHP) ...................................................................... 12Table 4.4 Comparison of budget and expenditure for the <strong>LHW</strong>P (Rs. million) .............. 12Table 4.5 Number of persons registered with an <strong>LHW</strong>.................................................. 13Table 4.6 Ratio of LHS to <strong>LHW</strong>s by province/area, June 2002–June 2008 .................. 13Table 4.7 Number of <strong>LHW</strong>s assigned for supervision ................................................... 14Table 5.1 Comparison of <strong>LHW</strong> and LHS knowledge scores between 2000 and2008 .............................................................................................................. 22Table 5.2 Percentage of <strong>LHW</strong>s attending refresher training in 2007/08, byprovince/region .............................................................................................. 23Table 5.3 <strong>LHW</strong> training that was provided by at least one female trainer ..................... 23Table 5.4 Number of facility trainers per facility, by province, June 2008 ..................... 24Table 5.5 Comparison of number of trainers available, by level and province,June 2003 and June 2008 ............................................................................. 24Table 6.1 Percentage of <strong>LHW</strong>s who have been out of stock for more than twomonths ........................................................................................................... 34Table 6.2 Difference between PC-1 monthly requirement for medicine, and actualprocured per <strong>LHW</strong> ......................................................................................... 35Table 6.3 Comparison of procuring a bundle of medicines in accordance with thePC-1, and in accordance with the <strong>LHW</strong> dispensing rate ............................... 37Table 6.4 Percentage of <strong>LHW</strong>s with functional equipment and administrativeTable 7.1material .......................................................................................................... 38Distribution of time since each <strong>LHW</strong> and LHS last received her salary,with a comparison to 2000 ............................................................................ 46Table 8.1 Number of days each <strong>LHW</strong> reported working in the previous week .............. 53Table 8.2 <strong>LHW</strong> household visits, by Performance Score quartile ................................. 53Table 8.3 <strong>LHW</strong> supervision meetings ............................................................................ 53Table 8.4 Ratio of FPOs to districts ............................................................................... 55Table 9.1Number of vehicles purchased per year, and the number of vehiclescondemned, 1993–2008 ................................................................................ 58Table 9.2 Number of vehicles purchased per year, 1993–2008 .................................... 59Table 9.3 Ratio of vehicles to LHSs, by year, by province/region ................................. 60Table 9.4 LHS access to Programme vehicles, and POL received ............................... 60Table 9.5 Number of operational vehicles, by year, by province/region, asrecorded in the PSP database....................................................................... 61Table 9.6 Planned POL budget for 2007/08, considering the actual number ofvehicles ......................................................................................................... 62Table 10.1 Percentage of <strong>LHW</strong>s and LHSs who had produced and could show awork-plan for the current month, and a monthly report for the previousmonth, comparing 2000 with 2008 ................................................................ 70Table 10.2 Who prepares the Health Facility MIS monthly report? ................................. 70Table 10.3 Were the new or improved MIS tools developed as planned in theStrategic Plan? .............................................................................................. 71Table A.1 All variations in curriculum since 2000 .......................................................... 79Table B.1 Positions, roles, sources of funding and employment status ofpersonnel working for the <strong>LHW</strong>P ................................................................... 83Table C.1 Strategic Plan KPIs for the expansion of coverage, and their measures ...... 86xiii


