LHW Systems Review - Oxford Policy Management
LHW Systems Review - Oxford Policy Management
LHW Systems Review - Oxford Policy Management
You also want an ePaper? Increase the reach of your titles
YUMPU automatically turns print PDFs into web optimized ePapers that Google loves.
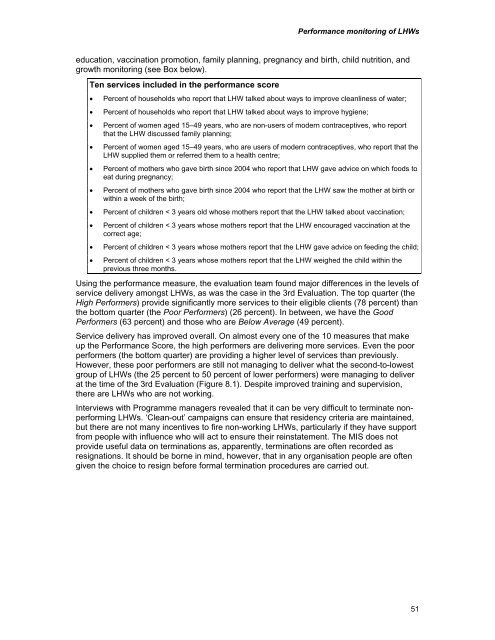
Performance monitoring of <strong>LHW</strong>seducation, vaccination promotion, family planning, pregnancy and birth, child nutrition, andgrowth monitoring (see Box below).Ten services included in the performance score• Percent of households who report that <strong>LHW</strong> talked about ways to improve cleanliness of water;• Percent of households who report that <strong>LHW</strong> talked about ways to improve hygiene;• Percent of women aged 15–49 years, who are non-users of modern contraceptives, who reportthat the <strong>LHW</strong> discussed family planning;• Percent of women aged 15–49 years, who are users of modern contraceptives, who report that the<strong>LHW</strong> supplied them or referred them to a health centre;• Percent of mothers who gave birth since 2004 who report that <strong>LHW</strong> gave advice on which foods toeat during pregnancy;• Percent of mothers who gave birth since 2004 who report that the <strong>LHW</strong> saw the mother at birth orwithin a week of the birth;• Percent of children < 3 years old whose mothers report that the <strong>LHW</strong> talked about vaccination;• Percent of children < 3 years whose mothers report that the <strong>LHW</strong> encouraged vaccination at thecorrect age;• Percent of children < 3 years whose mothers report that the <strong>LHW</strong> gave advice on feeding the child;• Percent of children < 3 years whose mothers report that the <strong>LHW</strong> weighed the child within theprevious three months.Using the performance measure, the evaluation team found major differences in the levels ofservice delivery amongst <strong>LHW</strong>s, as was the case in the 3rd Evaluation. The top quarter (theHigh Performers) provide significantly more services to their eligible clients (78 percent) thanthe bottom quarter (the Poor Performers) (26 percent). In between, we have the GoodPerformers (63 percent) and those who are Below Average (49 percent).Service delivery has improved overall. On almost every one of the 10 measures that makeup the Performance Score, the high performers are delivering more services. Even the poorperformers (the bottom quarter) are providing a higher level of services than previously.However, these poor performers are still not managing to deliver what the second-to-lowestgroup of <strong>LHW</strong>s (the 25 percent to 50 percent of lower performers) were managing to deliverat the time of the 3rd Evaluation (Figure 8.1). Despite improved training and supervision,there are <strong>LHW</strong>s who are not working.Interviews with Programme managers revealed that it can be very difficult to terminate nonperforming<strong>LHW</strong>s. ‘Clean-out’ campaigns can ensure that residency criteria are maintained,but there are not many incentives to fire non-working <strong>LHW</strong>s, particularly if they have supportfrom people with influence who will act to ensure their reinstatement. The MIS does notprovide useful data on terminations as, apparently, terminations are often recorded asresignations. It should be borne in mind, however, that in any organisation people are oftengiven the choice to resign before formal termination procedures are carried out.51


