<strong>LHW</strong>P – <strong>Systems</strong> <strong>Review</strong>to remain unchanged. The challenge that the Programme faced was in expanding thecoverage to underserved and poor rural areas.4.5 System performance4.5.1 Performance indicatorsUltimately, the target of 100,000 <strong>LHW</strong>s was almost achieved The Programme hasrecorded almost 71,000 working <strong>LHW</strong>s in mid 2003 (Table 4.3). 18 This number continued tofall in 2004, followed by a steady increase over the subsequent four years.By June 2005, when 100,000 <strong>LHW</strong>s were to have been recruited, there were 83,280 <strong>LHW</strong>son record. It was not until June 2008 that the Programme could record around 90,000 <strong>LHW</strong>s,including fewer than 1,000 in their first three months’ training (Table 4.3).Table 4.3<strong>LHW</strong>s working and in training, FY 2003/04–2007/08 (includingthose funded by the RHP and WHP)June 2003 2004 2005 2006 2007 2008Working at end of FY, including RHPand WHP70,738 69,690 78,595 85,620 87,119 89,125<strong>LHW</strong>s in training 4,300 3,208 4,685 1,293 2,047 949Total of <strong>LHW</strong>S working and intraining75,038 72,898 83,280 86,913 89,166 90,074Note: The record is taken from the month of June, the end of the financial year. It includes those funded underRHP and WHP.Source: PSP database January 2009, <strong>LHW</strong>P, MoH.Insufficient funding to achieve target recruitment A simple explanation for theProgramme being unable to reach the target number of <strong>LHW</strong>s is insufficient funding (Table4.4). The funding required increases as a function of each working <strong>LHW</strong>. The <strong>LHW</strong>P’s fixedcosts are low. The budget forecast (FYs 2003/04–2007/08) was based on funding for100,000 <strong>LHW</strong>s and 4,000 LHSs. However, by the end of this period the Programme had onlyreceived 87 percent of their allocated funds. Each year the budget allocation and releaseswere less than the Programme requested. In addition to releases that were lower than therequest, the <strong>LHW</strong> stipend had doubled. Salary increases had been budgeted for, but thiswas on the extraordinary orders of the Prime Minister and the President. Salary increaseswere awarded and, in June 2007, the Programme received additional funds. 19Table 4.4Comparison of budget and expenditure for the <strong>LHW</strong>P (Rs. million)2003/04 2004/05 2005/06 2006/07 2007/08 TotalPC-1 request 4,493.591 3,913.643 4,080.083 4,403.134 4,643.050 21,533.500PSDP provision (budgetallocation)2,600.000 3,430.780 3,880.000 4,962.343 4,892.000 19,765.120Funds released 2,434.012 3,088.288 3,880.000 4,962.342 4,634.870 18,999.510Total expenditure 2,427.017 2,951.117 3,862.182 4,945.734 4,632.628 18,818.680Expenditure/budgetallocation (%)93 86 100 100 95 95Expenditure / release (%) 100 96 100 100 100 99Expenditure/PC-1 request(%)54 75 95 112 100 87Source: <strong>LHW</strong>P, MoH.184,000 fewer than the number recorded in the PC-1.19See the Finance and Economic Analysis Report, <strong>Oxford</strong> <strong>Policy</strong> <strong>Management</strong>, August 2009.12
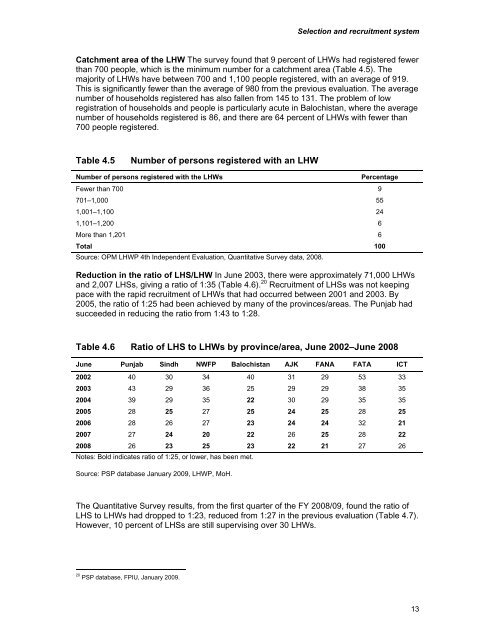
Selection and recruitment systemCatchment area of the <strong>LHW</strong> The survey found that 9 percent of <strong>LHW</strong>s had registered fewerthan 700 people, which is the minimum number for a catchment area (Table 4.5). Themajority of <strong>LHW</strong>s have between 700 and 1,100 people registered, with an average of 919.This is significantly fewer than the average of 980 from the previous evaluation. The averagenumber of households registered has also fallen from 145 to 131. The problem of lowregistration of households and people is particularly acute in Balochistan, where the averagenumber of households registered is 86, and there are 64 percent of <strong>LHW</strong>s with fewer than700 people registered.Table 4.5Number of persons registered with an <strong>LHW</strong>Number of persons registered with the <strong>LHW</strong>sPercentageFewer than 700 9701–1,000 551,001–1,100 241,101–1,200 6More than 1,201 6Total 100Source: OPM <strong>LHW</strong>P 4th Independent Evaluation, Quantitative Survey data, 2008.Reduction in the ratio of LHS/<strong>LHW</strong> In June 2003, there were approximately 71,000 <strong>LHW</strong>sand 2,007 LHSs, giving a ratio of 1:35 (Table 4.6). 20 Recruitment of LHSs was not keepingpace with the rapid recruitment of <strong>LHW</strong>s that had occurred between 2001 and 2003. By2005, the ratio of 1:25 had been achieved by many of the provinces/areas. The Punjab hadsucceeded in reducing the ratio from 1:43 to 1:28.Table 4.6 Ratio of LHS to <strong>LHW</strong>s by province/area, June 2002–June 2008June Punjab Sindh NWFP Balochistan AJK FANA FATA ICT2002 40 30 34 40 31 29 53 332003 43 29 36 25 29 29 38 352004 39 29 35 22 30 29 35 352005 28 25 27 25 24 25 28 252006 28 26 27 23 24 24 32 212007 27 24 20 22 26 25 28 222008 26 23 25 23 22 21 27 26Notes: Bold indicates ratio of 1:25, or lower, has been met.Source: PSP database January 2009, <strong>LHW</strong>P, MoH.The Quantitative Survey results, from the first quarter of the FY 2008/09, found the ratio ofLHS to <strong>LHW</strong>s had dropped to 1:23, reduced from 1:27 in the previous evaluation (Table 4.7).However, 10 percent of LHSs are still supervising over 30 <strong>LHW</strong>s.20PSP database, FPIU, January 2009.13