LHW Systems Review - Oxford Policy Management
LHW Systems Review - Oxford Policy Management
LHW Systems Review - Oxford Policy Management

You also want an ePaper? Increase the reach of your titles
YUMPU automatically turns print PDFs into web optimized ePapers that Google loves.
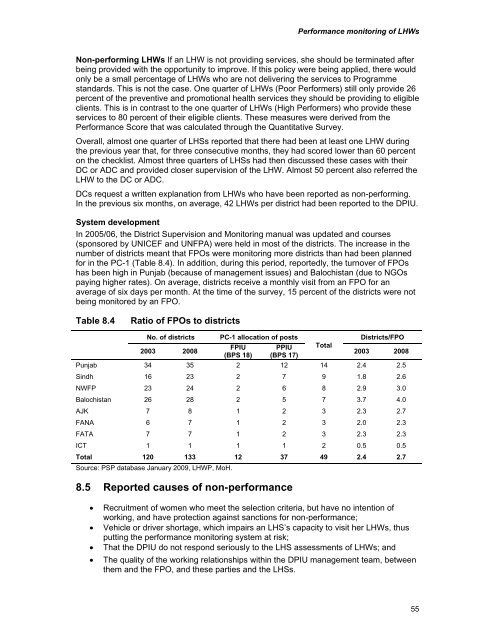
Performance monitoring of <strong>LHW</strong>sNon-performing <strong>LHW</strong>s If an <strong>LHW</strong> is not providing services, she should be terminated afterbeing provided with the opportunity to improve. If this policy were being applied, there wouldonly be a small percentage of <strong>LHW</strong>s who are not delivering the services to Programmestandards. This is not the case. One quarter of <strong>LHW</strong>s (Poor Performers) still only provide 26percent of the preventive and promotional health services they should be providing to eligibleclients. This is in contrast to the one quarter of <strong>LHW</strong>s (High Performers) who provide theseservices to 80 percent of their eligible clients. These measures were derived from thePerformance Score that was calculated through the Quantitative Survey.Overall, almost one quarter of LHSs reported that there had been at least one <strong>LHW</strong> duringthe previous year that, for three consecutive months, they had scored lower than 60 percenton the checklist. Almost three quarters of LHSs had then discussed these cases with theirDC or ADC and provided closer supervision of the <strong>LHW</strong>. Almost 50 percent also referred the<strong>LHW</strong> to the DC or ADC.DCs request a written explanation from <strong>LHW</strong>s who have been reported as non-performing.In the previous six months, on average, 42 <strong>LHW</strong>s per district had been reported to the DPIU.System developmentIn 2005/06, the District Supervision and Monitoring manual was updated and courses(sponsored by UNICEF and UNFPA) were held in most of the districts. The increase in thenumber of districts meant that FPOs were monitoring more districts than had been plannedfor in the PC-1 (Table 8.4). In addition, during this period, reportedly, the turnover of FPOshas been high in Punjab (because of management issues) and Balochistan (due to NGOspaying higher rates). On average, districts receive a monthly visit from an FPO for anaverage of six days per month. At the time of the survey, 15 percent of the districts were notbeing monitored by an FPO.Table 8.4Ratio of FPOs to districtsNo. of districts2003 2008PC-1 allocation of postsFPIU(BPS 18)PPIU(BPS 17)TotalDistricts/FPO2003 2008Punjab 34 35 2 12 14 2.4 2.5Sindh 16 23 2 7 9 1.8 2.6NWFP 23 24 2 6 8 2.9 3.0Balochistan 26 28 2 5 7 3.7 4.0AJK 7 8 1 2 3 2.3 2.7FANA 6 7 1 2 3 2.0 2.3FATA 7 7 1 2 3 2.3 2.3ICT 1 1 1 1 2 0.5 0.5Total 120 133 12 37 49 2.4 2.7Source: PSP database January 2009, <strong>LHW</strong>P, MoH.8.5 Reported causes of non-performance• Recruitment of women who meet the selection criteria, but have no intention ofworking, and have protection against sanctions for non-performance;• Vehicle or driver shortage, which impairs an LHS’s capacity to visit her <strong>LHW</strong>s, thusputting the performance monitoring system at risk;• That the DPIU do not respond seriously to the LHS assessments of <strong>LHW</strong>s; and• The quality of the working relationships within the DPIU management team, betweenthem and the FPO, and these parties and the LHSs.55